

Question: OVERVIEW Barb Williams and Rick Thomas, two managers from service firms, were attending a weeklong executive education course at a well-known business school in November
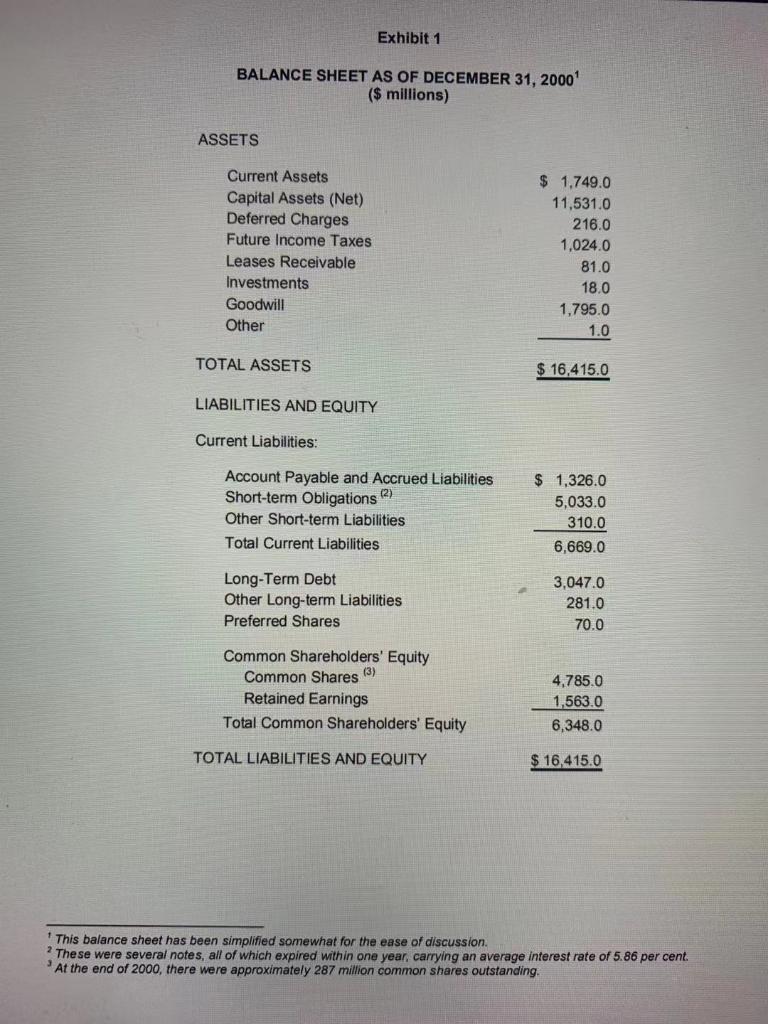
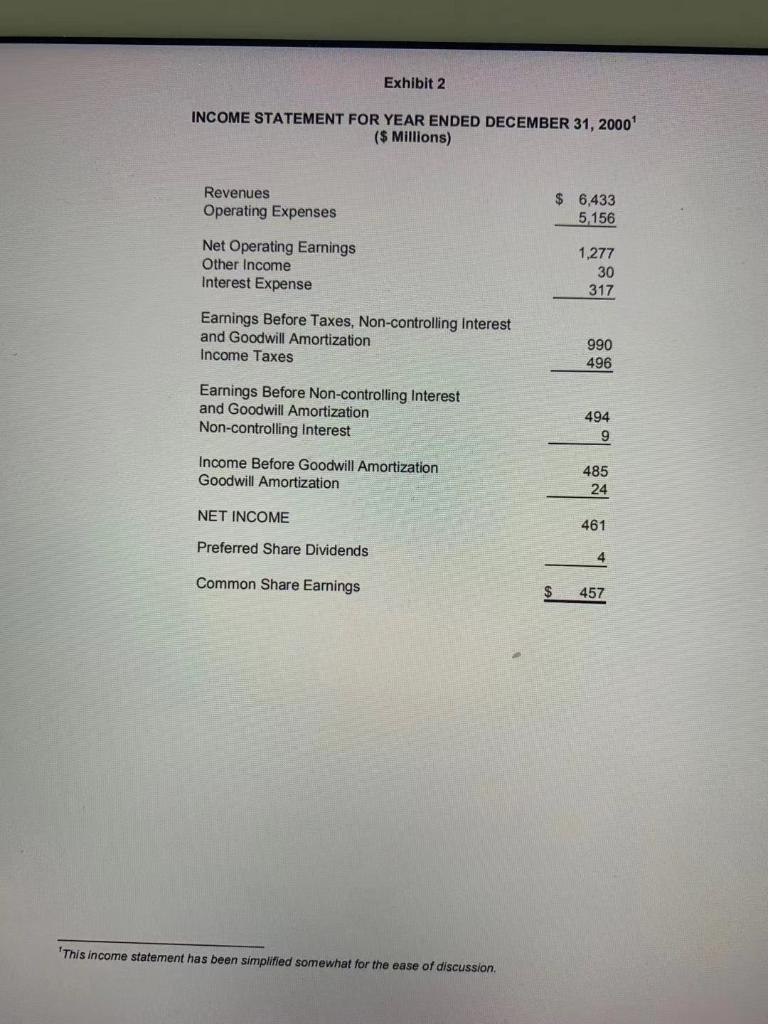
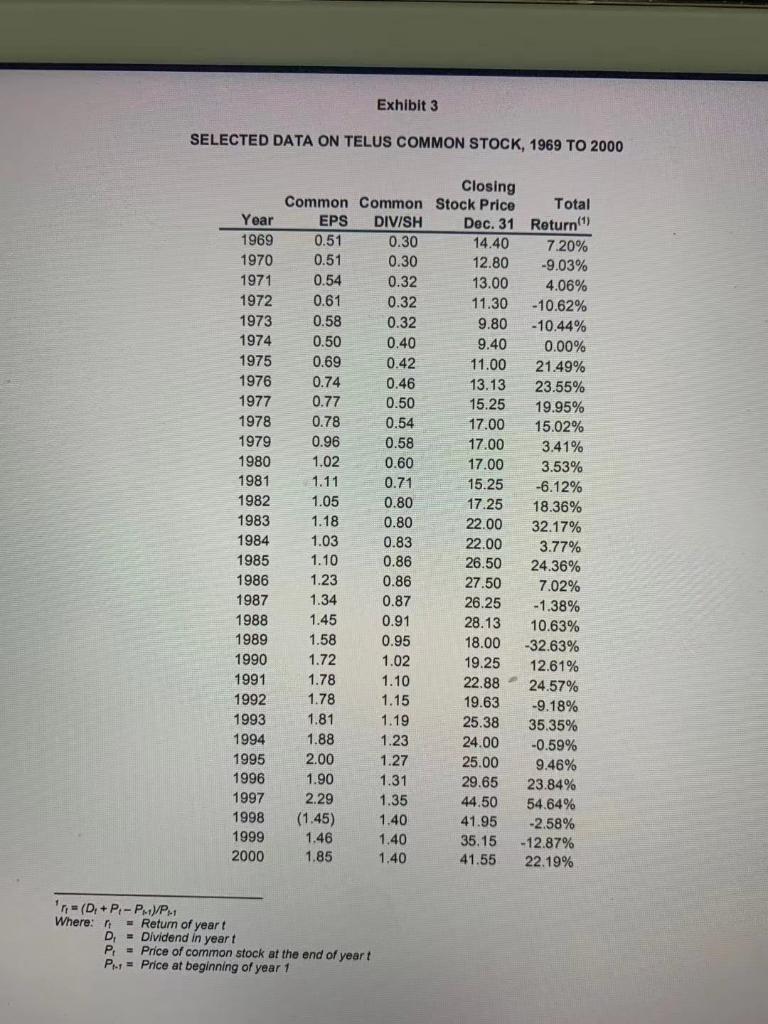
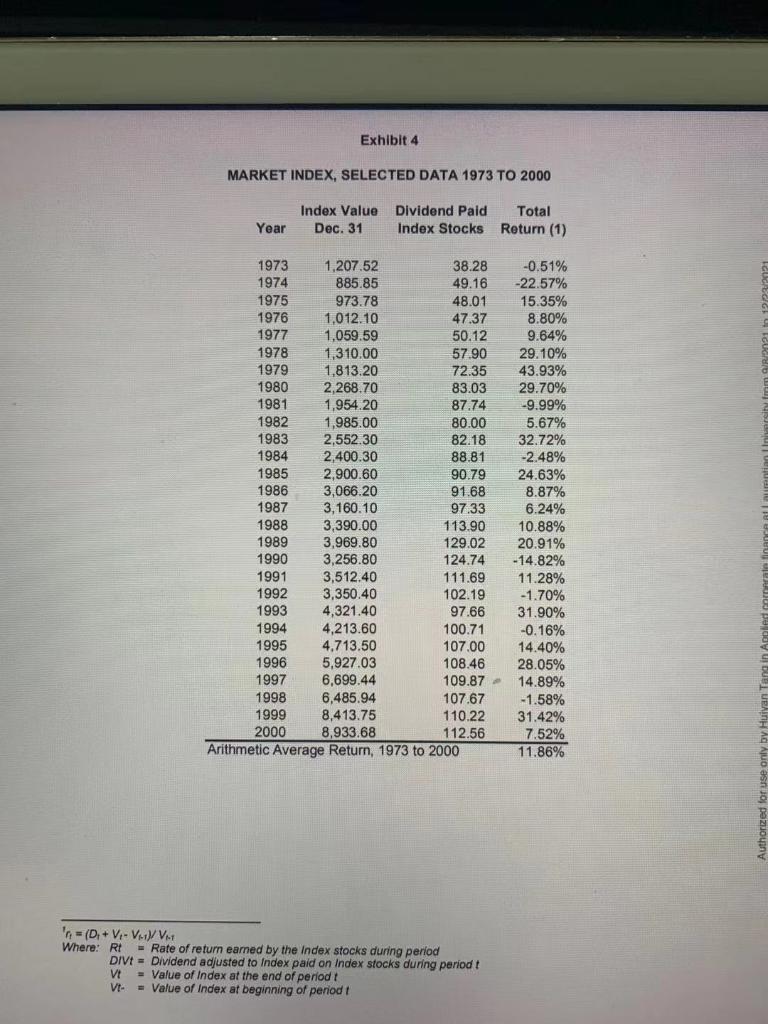
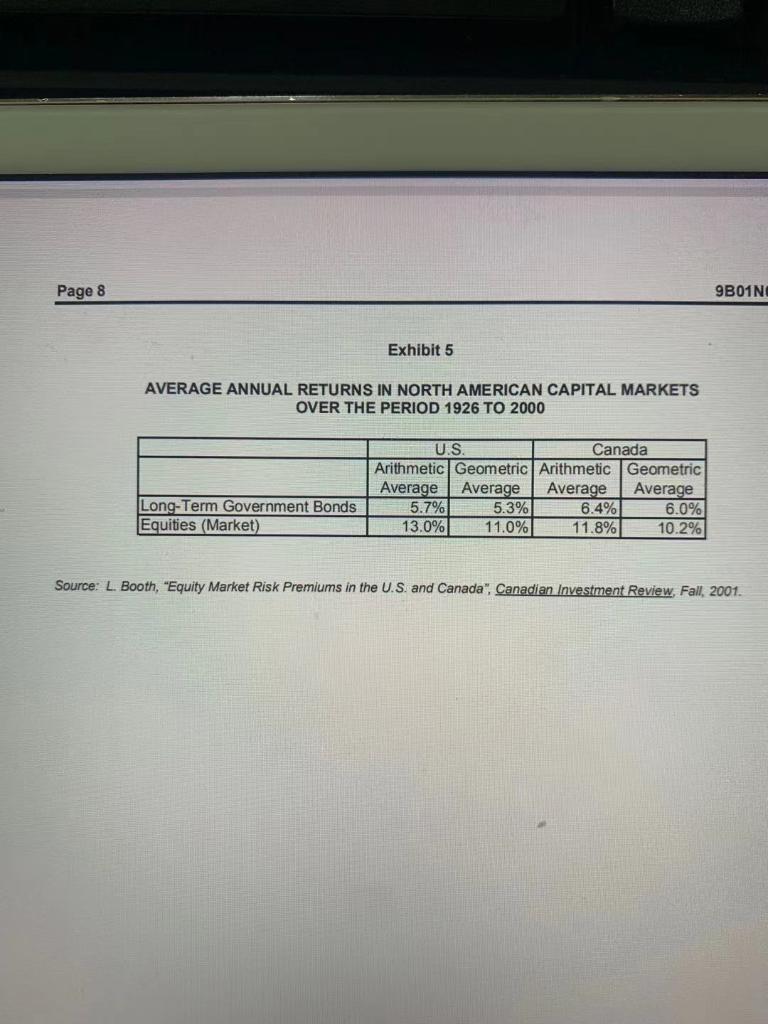
OVERVIEW Barb Williams and Rick Thomas, two managers from service firms, were attending a weeklong executive education course at a well-known business school in November 2001. Both had read an article dealing with the cost of capital as preparation for the next day's classroom session. As they vigorously discussed the concept, it became clear that they had several differences of opinion. Their assignment was to calculate the cost of capital for Telus Corporation (Telus). Telus was a leading telecommunications company providing a variety of data, voice, and wireless services to both businesses and consumers. The data they gathered are presented in Exhibits 1 to 5. Rick. What we really want to know is the hurdle rate that Telus should use for its capital investment projects. Barb: Yes, and we should decide whether the rate ought to be different for different types of projects, such as the purchase of labor-saving equipment or the building of fibre optics underground telecommunications corridors. Rick: Looking at the balance sheet, I can see that the firm raises funds from quite a few different sources. The best place to start is to look at the cost of the capital raised from each of these sources. The current liabilities except for the "short-term obligations are mostly trade credit, so their cost is zero. Barb: Well, the long-term debt isn't interest free, and some of it is quite expensive. For example, the 2021 Telus bonds were issued with a 10.65 per cent coupon. The newspaper says that long-term government bonds are yielding 5.82 per cent. Rick: But shouldn't we be using current yields that are much lower than the firm paid in the past? My calculations tell me that based on an average coupon rate of 11.00 per cent on all of the long-term Telus bond issues outstanding, with average maturities of about 15 years and average asking prices of about $118.00 the current average yield is actually 8.81 per cent." Barb: Notice that Telus borrows money from the banks and through the short-term money market as well. Some of its short-term debt is obtained by issuing commercial paper, but most of it is from bank borrowings Rick: Well, the prime rate from banks is 4.50 per cent and I suppose that Telus might qualify for the prime rate wouldn't they? The three-month commercial paper rate is extremely low, currently 2.28 per cent, which is even more attractive to the firm. In case we need more information, I also noted that the current rate on 91-day, government treasury bills is 2.15 per cent. Barb: : Telus was able to issue two major preferred stocks at a cost of only 5.00 per cent in the past. That's a lot cheaper than the debt, even though about $4.00 for every $100 par value share went to the underwriter. Rick: The two major preferred issues outstanding were issued at par values of $100 per share and $25 per share respectively, and are currently trading to yield about 5.90 per cent each. The company has not issued preferreds for a long time and may not intend to issue them again. Preferreds have a higher after-tax cost than debt according to our instructor, and that makes them less attractive for most issuers - 8 20 Barb: Well, if that's true, maybe we can ignore the preferred in our calculations. Rick Calculating the cost of common stock is reasonably straightforward. Since the common shareholders are getting regular dividends, we should use the dividend yield. Barb: No, no! All of the earnings after the dividends to the preferred shareholders belong to the common shareholder, not just the dividends. We should use the earnings-per-share divided by the market price. . Rick What about issuing costs? Although the current stock price has dropped to around $25.00 per share, Telus would likely have to pay the underwriter and others about $1.75 per share to issue new stock at this price. Barb: It's not likely that Telus will raise more than one-quarter of its new equity by issuing stock. The rest of the new equity will be retained earnings, which have no cost. Retained earnings aren't free capital. They belong to the shareholders. Surely they must expect some type of return! Barb: I notice from the firm's financial statements that the return on common equity for the company was 7.36 per cent in 2000 and 8.17 per cent in 1999. I realize this is an accounting rate of retum computed on the book value of the equity, but I wonder if it can be used to compute the cost of equity capital? Authorized for use only by Huiyan Rick Rick: I would guess that the funds generated by depreciation are free and they are available in large amounts. For example, last year's earnings were over $457 million after deduction of preferred dividends. Depreciation was over $1 billion. Capital expenditures for next year are expected to be about $1.5 billion, so perhaps the bulk of the money can come from depreciation. Barb: The assigned reading mentioned the beta of a stock. The beta is calculated by regressing the return for Telus against the return on the market index. I went to the library's Bloomberg system and found the beta, estimated based on three years of monthly data ending November 2001, to be 0.75 with an R-squared of 0.13. The beta seems to be an index of the riskiness of the common stock, but it has to be converted into a required return somehow. What I don't understand is how that return compares with the one we get by simply dividing the earnings-per-share by the stock price. Rick: What do we do once we have the costs of all sources of financing? Do we just take their average? Barb: Somehow, the average cost doesn't make sense to me. I think we should just use the cost of the next source of financing. For example, Telus expects to issue $30 million in debt next month. Maybe the interest rate on that issue should be used as the hurdle rate for any new projects that are undertaken with those funds. Rick After we get this cost of capital, would you advise Telus to use the net-present value method or the internal-rate of return method to evaluate projects? Barb: I don't think it matters. The two methods both give the same answer. Rick: Well, let's get on with this calculation. We have a long night ahead of us. I wish someone would just "Telus the cost of capital! Exhibit 1 BALANCE SHEET AS OF DECEMBER 31, 2000 ($ millions) ASSETS Current Assets Capital Assets (Net) Deferred Charges Future Income Taxes Leases Receivable Investments Goodwill Other $ 1,749.0 11,531.0 216.0 1,024.0 81.0 18.0 1.795.0 1.0 TOTAL ASSETS $ 16,415.0 LIABILITIES AND EQUITY Current Liabilities: Account Payable and Accrued Liabilities Short-term Obligations Other Short-term Liabilities Total Current Liabilities $ 1,326.0 5,033.0 310.0 6,669.0 Long-Term Debt Other Long-term Liabilities Preferred Shares 3,047.0 281.0 70.0 Common Shareholders' Equity Common Shares (3) Retained Earnings Total Common Shareholders' Equity 4,785.0 1,563.0 6,348.0 TOTAL LIABILITIES AND EQUITY $ 16,415.0 This balance sheet has been simplified somewhat for the ease of discussion These were several notes, all of which expired within one year, carrying an average interest rate of 5.86 per cent. At the end of 2000, there were approximately 287 million common shares outstanding. Exhibit 2 INCOME STATEMENT FOR YEAR ENDED DECEMBER 31, 2000 ($ Millions) Revenues Operating Expenses $ 6,433 5,156 Net Operating Earnings Other Income Interest Expense 1,277 30 317 Earnings Before Taxes, Non-controlling Interest and Goodwill Amortization Income Taxes 990 496 Earnings Before Non-controlling Interest and Goodwill Amortization Non-controlling Interest 494 9 Income Before Goodwill Amortization Goodwill Amortization 485 24 NET INCOME 461 Preferred Share Dividends 4 Common Share Earnings $ 457 'This income statement has been simplified somewhat for the ease of discussion Exhibit 3 SELECTED DATA ON TELUS COMMON STOCK, 1969 TO 2000 Year 1969 1970 1971 1972 1973 1974 1975 1976 1977 1978 1979 1980 1981 1982 1983 1984 1985 1986 1987 1988 1989 1990 1991 1992 1993 1994 1995 1996 1997 1998 1999 2000 Closing Common Common Stock Price Total EPS DIVISH Dec. 31 Return 0.51 0.30 14.40 7.20% 0.51 0.30 12.80 -9.03% 0.54 0.32 13.00 4.06% 0.61 0.32 11.30 -10.62% 0.58 0.32 9.80 -10.44% 0.50 0.40 9.40 0.00% 0.69 0.42 11.00 21.49% 0.74 0.46 13.13 23.55% 0.77 0.50 15.25 19.95% 0.78 0.54 17.00 15.02% 0.96 0.58 17.00 3.41% 1.02 0.60 17.00 3.53% 1.11 0.71 15.25 -6.12% 1.05 0.80 17.25 18.36% 1.18 0.80 22.00 32.17% 1.03 0.83 22.00 3.77% 1.10 0.86 26.50 24.36% 1.23 0.86 27.50 7.02% 1.34 0.87 26.25 -1.38% 1.45 0.91 28.13 10.63% 1.58 0.95 18.00 -32.63% 1.72 1.02 19.25 12.61% 1.78 1.10 22.88 - 24.57% 1.78 19.63 -9.18% 1.81 1.19 25.38 35.35% 1.88 24.00 -0.59% 2.00 1.27 25.00 9.46% 1.90 1.31 29.65 23.84% 2.29 1.35 44.50 54.64% (1.45) 1.40 41.95 -2.58% 1.46 1.40 35.15 -12.87% 1.85 1.40 41.55 22.19% 1.15 1.23 (DP-P-P-1 Where: - Return of yeart D - Dividend in yeart P = Price of common stock at the end of yeart P.-= Price at beginning of year 1 Exhibit 4 MARKET INDEX, SELECTED DATA 1973 TO 2000 Year Index Value Dividend Paid Total Dec. 31 Index Stocks Return (1) 1973 50.12 1,207,52 38.28 1974 885.85 49.16 1975 973.78 48.01 1976 1,012.10 47.37 1977 1,059.59 1978 1,310.00 57.90 1979 1,813.20 72.35 1980 2,268.70 83.03 1981 1,954.20 87.74 1982 1,985.00 80.00 1983 2,552.30 82.18 1984 2,400.30 88.81 1985 2,900.60 90.79 1986 3,066.20 91.68 1987 3,160.10 97.33 1988 3,390.00 113.90 1989 3,969.80 129.02 1990 3,256.80 124.74 1991 3,512.40 111.69 1992 3,350.40 102.19 1993 4,321.40 97.66 1994 4,213.60 100.71 1995 4.713.50 107.00 1996 5,927.03 108.46 1997 6,699.44 109.87 - 1998 6,485.94 107.67 1999 8,413.75 110.22 2000 8,933.68 112.56 Arithmetic Average Return, 1973 to 2000 -0.51% -22.57% 15.35% 8.80% 9.64% 29.10% 43.93% 29.70% -9.99% 5.67% 32.72% -2.48% 24.63% 8.87% 6.24% 10.88% 20.91% - 14.82% 11.28% -1.70% 31.90% -0.16% 14.40% 28.05% 14.89% -1.58% 31.42% 7.52% 11.86% (D,+ V-V. V. Where: Rt = Rate of return earned by the Index stocks during period DIVE = Dividend adjusted to Index paid on Index stocks during period t V = Value of Index at the end of periodt VI- = Value of Index at beginning of period Page 8 9B01N Exhibit 5 AVERAGE ANNUAL RETURNS IN NORTH AMERICAN CAPITAL MARKETS OVER THE PERIOD 1926 TO 2000 U.S. Canada Arithmetic Geometric Arithmetic Geometric Average Average Average Average 5.7% 5.3% 6.4% 6.0% 13.0% 11.0% 11.8% 10.2% Long-Term Government Bonds Equities (Market) Source: L. Booth, "Equity Market Risk Premiums in the U.S. and Canada", Canadian Investment Review, Fall, 2001. Guidance on how to proceed Review relevant chapters from textbook and use the suggestions for issues to address in your live case study as a guide. Address all the issues that the case allows you to address. Some additional issues you may want to highlight include: . . Overview of the case What's cost of capital? Why is cost of capital important? How has Telus financed itself in the past? You may want to use the past as a guide for the target cost of capital going forward. Compute cost of capital for Telus For cost of debt and preferred, you can use the current yields given in the case. You can use market values or book values for the WACC weights. While market values are preferred, book values are sometimes used in practice for simplicity. Are you missing any information that would have improved your analysis? . . OVERVIEW Barb Williams and Rick Thomas, two managers from service firms, were attending a weeklong executive education course at a well-known business school in November 2001. Both had read an article dealing with the cost of capital as preparation for the next day's classroom session. As they vigorously discussed the concept, it became clear that they had several differences of opinion. Their assignment was to calculate the cost of capital for Telus Corporation (Telus). Telus was a leading telecommunications company providing a variety of data, voice, and wireless services to both businesses and consumers. The data they gathered are presented in Exhibits 1 to 5. Rick. What we really want to know is the hurdle rate that Telus should use for its capital investment projects. Barb: Yes, and we should decide whether the rate ought to be different for different types of projects, such as the purchase of labor-saving equipment or the building of fibre optics underground telecommunications corridors. Rick: Looking at the balance sheet, I can see that the firm raises funds from quite a few different sources. The best place to start is to look at the cost of the capital raised from each of these sources. The current liabilities except for the "short-term obligations are mostly trade credit, so their cost is zero. Barb: Well, the long-term debt isn't interest free, and some of it is quite expensive. For example, the 2021 Telus bonds were issued with a 10.65 per cent coupon. The newspaper says that long-term government bonds are yielding 5.82 per cent. Rick: But shouldn't we be using current yields that are much lower than the firm paid in the past? My calculations tell me that based on an average coupon rate of 11.00 per cent on all of the long-term Telus bond issues outstanding, with average maturities of about 15 years and average asking prices of about $118.00 the current average yield is actually 8.81 per cent." Barb: Notice that Telus borrows money from the banks and through the short-term money market as well. Some of its short-term debt is obtained by issuing commercial paper, but most of it is from bank borrowings Rick: Well, the prime rate from banks is 4.50 per cent and I suppose that Telus might qualify for the prime rate wouldn't they? The three-month commercial paper rate is extremely low, currently 2.28 per cent, which is even more attractive to the firm. In case we need more information, I also noted that the current rate on 91-day, government treasury bills is 2.15 per cent. Barb: : Telus was able to issue two major preferred stocks at a cost of only 5.00 per cent in the past. That's a lot cheaper than the debt, even though about $4.00 for every $100 par value share went to the underwriter. Rick: The two major preferred issues outstanding were issued at par values of $100 per share and $25 per share respectively, and are currently trading to yield about 5.90 per cent each. The company has not issued preferreds for a long time and may not intend to issue them again. Preferreds have a higher after-tax cost than debt according to our instructor, and that makes them less attractive for most issuers - 8 20 Barb: Well, if that's true, maybe we can ignore the preferred in our calculations. Rick Calculating the cost of common stock is reasonably straightforward. Since the common shareholders are getting regular dividends, we should use the dividend yield. Barb: No, no! All of the earnings after the dividends to the preferred shareholders belong to the common shareholder, not just the dividends. We should use the earnings-per-share divided by the market price. . Rick What about issuing costs? Although the current stock price has dropped to around $25.00 per share, Telus would likely have to pay the underwriter and others about $1.75 per share to issue new stock at this price. Barb: It's not likely that Telus will raise more than one-quarter of its new equity by issuing stock. The rest of the new equity will be retained earnings, which have no cost. Retained earnings aren't free capital. They belong to the shareholders. Surely they must expect some type of return! Barb: I notice from the firm's financial statements that the return on common equity for the company was 7.36 per cent in 2000 and 8.17 per cent in 1999. I realize this is an accounting rate of retum computed on the book value of the equity, but I wonder if it can be used to compute the cost of equity capital? Authorized for use only by Huiyan Rick Rick: I would guess that the funds generated by depreciation are free and they are available in large amounts. For example, last year's earnings were over $457 million after deduction of preferred dividends. Depreciation was over $1 billion. Capital expenditures for next year are expected to be about $1.5 billion, so perhaps the bulk of the money can come from depreciation. Barb: The assigned reading mentioned the beta of a stock. The beta is calculated by regressing the return for Telus against the return on the market index. I went to the library's Bloomberg system and found the beta, estimated based on three years of monthly data ending November 2001, to be 0.75 with an R-squared of 0.13. The beta seems to be an index of the riskiness of the common stock, but it has to be converted into a required return somehow. What I don't understand is how that return compares with the one we get by simply dividing the earnings-per-share by the stock price. Rick: What do we do once we have the costs of all sources of financing? Do we just take their average? Barb: Somehow, the average cost doesn't make sense to me. I think we should just use the cost of the next source of financing. For example, Telus expects to issue $30 million in debt next month. Maybe the interest rate on that issue should be used as the hurdle rate for any new projects that are undertaken with those funds. Rick After we get this cost of capital, would you advise Telus to use the net-present value method or the internal-rate of return method to evaluate projects? Barb: I don't think it matters. The two methods both give the same answer. Rick: Well, let's get on with this calculation. We have a long night ahead of us. I wish someone would just "Telus the cost of capital! Exhibit 1 BALANCE SHEET AS OF DECEMBER 31, 2000 ($ millions) ASSETS Current Assets Capital Assets (Net) Deferred Charges Future Income Taxes Leases Receivable Investments Goodwill Other $ 1,749.0 11,531.0 216.0 1,024.0 81.0 18.0 1.795.0 1.0 TOTAL ASSETS $ 16,415.0 LIABILITIES AND EQUITY Current Liabilities: Account Payable and Accrued Liabilities Short-term Obligations Other Short-term Liabilities Total Current Liabilities $ 1,326.0 5,033.0 310.0 6,669.0 Long-Term Debt Other Long-term Liabilities Preferred Shares 3,047.0 281.0 70.0 Common Shareholders' Equity Common Shares (3) Retained Earnings Total Common Shareholders' Equity 4,785.0 1,563.0 6,348.0 TOTAL LIABILITIES AND EQUITY $ 16,415.0 This balance sheet has been simplified somewhat for the ease of discussion These were several notes, all of which expired within one year, carrying an average interest rate of 5.86 per cent. At the end of 2000, there were approximately 287 million common shares outstanding. Exhibit 2 INCOME STATEMENT FOR YEAR ENDED DECEMBER 31, 2000 ($ Millions) Revenues Operating Expenses $ 6,433 5,156 Net Operating Earnings Other Income Interest Expense 1,277 30 317 Earnings Before Taxes, Non-controlling Interest and Goodwill Amortization Income Taxes 990 496 Earnings Before Non-controlling Interest and Goodwill Amortization Non-controlling Interest 494 9 Income Before Goodwill Amortization Goodwill Amortization 485 24 NET INCOME 461 Preferred Share Dividends 4 Common Share Earnings $ 457 'This income statement has been simplified somewhat for the ease of discussion Exhibit 3 SELECTED DATA ON TELUS COMMON STOCK, 1969 TO 2000 Year 1969 1970 1971 1972 1973 1974 1975 1976 1977 1978 1979 1980 1981 1982 1983 1984 1985 1986 1987 1988 1989 1990 1991 1992 1993 1994 1995 1996 1997 1998 1999 2000 Closing Common Common Stock Price Total EPS DIVISH Dec. 31 Return 0.51 0.30 14.40 7.20% 0.51 0.30 12.80 -9.03% 0.54 0.32 13.00 4.06% 0.61 0.32 11.30 -10.62% 0.58 0.32 9.80 -10.44% 0.50 0.40 9.40 0.00% 0.69 0.42 11.00 21.49% 0.74 0.46 13.13 23.55% 0.77 0.50 15.25 19.95% 0.78 0.54 17.00 15.02% 0.96 0.58 17.00 3.41% 1.02 0.60 17.00 3.53% 1.11 0.71 15.25 -6.12% 1.05 0.80 17.25 18.36% 1.18 0.80 22.00 32.17% 1.03 0.83 22.00 3.77% 1.10 0.86 26.50 24.36% 1.23 0.86 27.50 7.02% 1.34 0.87 26.25 -1.38% 1.45 0.91 28.13 10.63% 1.58 0.95 18.00 -32.63% 1.72 1.02 19.25 12.61% 1.78 1.10 22.88 - 24.57% 1.78 19.63 -9.18% 1.81 1.19 25.38 35.35% 1.88 24.00 -0.59% 2.00 1.27 25.00 9.46% 1.90 1.31 29.65 23.84% 2.29 1.35 44.50 54.64% (1.45) 1.40 41.95 -2.58% 1.46 1.40 35.15 -12.87% 1.85 1.40 41.55 22.19% 1.15 1.23 (DP-P-P-1 Where: - Return of yeart D - Dividend in yeart P = Price of common stock at the end of yeart P.-= Price at beginning of year 1 Exhibit 4 MARKET INDEX, SELECTED DATA 1973 TO 2000 Year Index Value Dividend Paid Total Dec. 31 Index Stocks Return (1) 1973 50.12 1,207,52 38.28 1974 885.85 49.16 1975 973.78 48.01 1976 1,012.10 47.37 1977 1,059.59 1978 1,310.00 57.90 1979 1,813.20 72.35 1980 2,268.70 83.03 1981 1,954.20 87.74 1982 1,985.00 80.00 1983 2,552.30 82.18 1984 2,400.30 88.81 1985 2,900.60 90.79 1986 3,066.20 91.68 1987 3,160.10 97.33 1988 3,390.00 113.90 1989 3,969.80 129.02 1990 3,256.80 124.74 1991 3,512.40 111.69 1992 3,350.40 102.19 1993 4,321.40 97.66 1994 4,213.60 100.71 1995 4.713.50 107.00 1996 5,927.03 108.46 1997 6,699.44 109.87 - 1998 6,485.94 107.67 1999 8,413.75 110.22 2000 8,933.68 112.56 Arithmetic Average Return, 1973 to 2000 -0.51% -22.57% 15.35% 8.80% 9.64% 29.10% 43.93% 29.70% -9.99% 5.67% 32.72% -2.48% 24.63% 8.87% 6.24% 10.88% 20.91% - 14.82% 11.28% -1.70% 31.90% -0.16% 14.40% 28.05% 14.89% -1.58% 31.42% 7.52% 11.86% (D,+ V-V. V. Where: Rt = Rate of return earned by the Index stocks during period DIVE = Dividend adjusted to Index paid on Index stocks during period t V = Value of Index at the end of periodt VI- = Value of Index at beginning of period Page 8 9B01N Exhibit 5 AVERAGE ANNUAL RETURNS IN NORTH AMERICAN CAPITAL MARKETS OVER THE PERIOD 1926 TO 2000 U.S. Canada Arithmetic Geometric Arithmetic Geometric Average Average Average Average 5.7% 5.3% 6.4% 6.0% 13.0% 11.0% 11.8% 10.2% Long-Term Government Bonds Equities (Market) Source: L. Booth, "Equity Market Risk Premiums in the U.S. and Canada", Canadian Investment Review, Fall, 2001. Guidance on how to proceed Review relevant chapters from textbook and use the suggestions for issues to address in your live case study as a guide. Address all the issues that the case allows you to address. Some additional issues you may want to highlight include: . . Overview of the case What's cost of capital? Why is cost of capital important? How has Telus financed itself in the past? You may want to use the past as a guide for the target cost of capital going forward. Compute cost of capital for Telus For cost of debt and preferred, you can use the current yields given in the case. You can use market values or book values for the WACC weights. While market values are preferred, book values are sometimes used in practice for simplicity. Are you missing any information that would have improved your analysis
Step by Step Solution
There are 3 Steps involved in it

Get step-by-step solutions from verified subject matter experts