

Question: Overview In this project, you will use the Point Source Gaussian Plume Model to approximate concentrations of a pollutant downwind of a power plant. The
Overview
In this project, you will use the Point Source Gaussian Plume Model to approximate concentrations of a pollutant downwind of a power plant. The Point Source Gaussian Plume Model is given by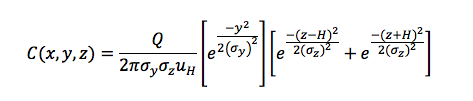
where x is distance along the plume centerline (m), y is the horizontal distance from the plume centerline (m), z is the vertical distance from ground surface at the emission site (m), Q is the source emission rate (g/s), H is the effective stack height (m), uH is the average wind velocity at z=H, ?y and ?z are the dispersion coefficients in the y and z directions (m).
Model Inputs
The average emission rate of SO2 from the power plant is 500 g/s, from a stack of height 100 m (assume H=120 m). The topography in the region is relatively flat so we can assume a ground surface at z=0 everywhere. The ground-level windspeed is 2m/s for stability class A, C, and F.
Model Outputs
Write a MATLAB code to calculate the ground-level SO2 concentration for 10 km downwind of the stack and 2 km on either side of the plume centerline (a 40 km2 area), for stability classes A, C and F. Generate a contour plot of ground-level concentration for each scenario.
Please use the link below to my code. I am not able to get the contour plot to work.
https://drive.google.com/file/d/1FDD1itMYzBu1vrdMfNJZ7-w1XoMI0uIl/view?usp=sharing
-(z-H -(z+H)2 C (x, y, z) = 2m,??uH
Step by Step Solution
There are 3 Steps involved in it

Get step-by-step solutions from verified subject matter experts