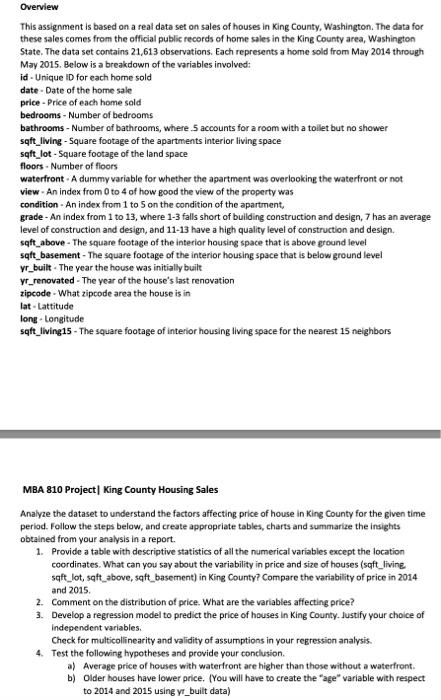
Question: Overview This assignment is based on a real data set on sales of houses in King County, Washington. The data for these sales comes from

Overview This assignment is based on a real data
Overview This assignment is based on a real data set on sales of houses in King County, Washington. The data for these sales comes from the official public records of home sales in the King County area, Washington State. The data set contains 21,613 observations. Each represents a home sold from May 2014 through May 2015. Below is a breakdown of the variables involved: id - Unique ID for each home sold date - Date of the home sale price - Price of each home sold bedrooms - Number of bedrooms bathrooms - Number of bathrooms, where 5 accounts for a room with a toilet but no shower sqft_living - Square footage of the apartments interior living space saft_lot - Square footage of the land space floors. Number of floors waterfront - A dummy variable for whether the apartment was overlooking the waterfront or not view - An index from 0 to 4 of how good the view of the property was condition - An index from 1 to 5 on the condition of the apartment, grade - An index from 1 to 13, where 1-3 falls short of building construction and design, 7 has an average level of construction and design, and 11-13 have a high quality level of construction and design. sqft_above - The square footage of the interior housing space that is above ground level sqft_basement - The square footage of the interior housing space that is below ground level Yr_built - The year the house was initially built yr_renovated - The year of the house's last renovation zipcode - What zipcode area the house is in lat- Lattitude long - Longitude saft_living15 - The square footage of interior housing living space for the nearest 15 neighbors MBA 810 Project King County Housing Sales Analyze the dataset to understand the factors affecting price of house in King County for the given time period. Follow the steps below, and create appropriate tables, charts and summarize the insights obtained from your analysis in a report. 1. Provide a table with descriptive statistics of all the numerical variables except the location coordinates. What can you say about the variability in price and size of houses (soft_living sqft_lot, saft_above, saft_basement) in King County? Compare the variability of price in 2014 and 2015 2. Comment on the distribution of price. What are the variables affecting price? 3. Develop a regression model to predict the price of houses in King County. Justify your choice of Independent variables. Check for multicolnearity and validity of assumptions in your regression analysis. 4. Test the following hypotheses and provide your conclusion a) Average price of houses with waterfront are higher than those without a waterfront b) Older houses have lower price. (You will have to create the age" variable with respect to 2014 and 2015 using yr_built data)

Step by Step Solution

There are 3 Steps involved in it

1 Expert Approved Answer
Step: 1 Unlock blur-text-image
Question Has Been Solved by an Expert!

Get step-by-step solutions from verified subject matter experts

Step: 2 Unlock
Step: 3 Unlock

Students Have Also Explored These Related General Management Questions!