

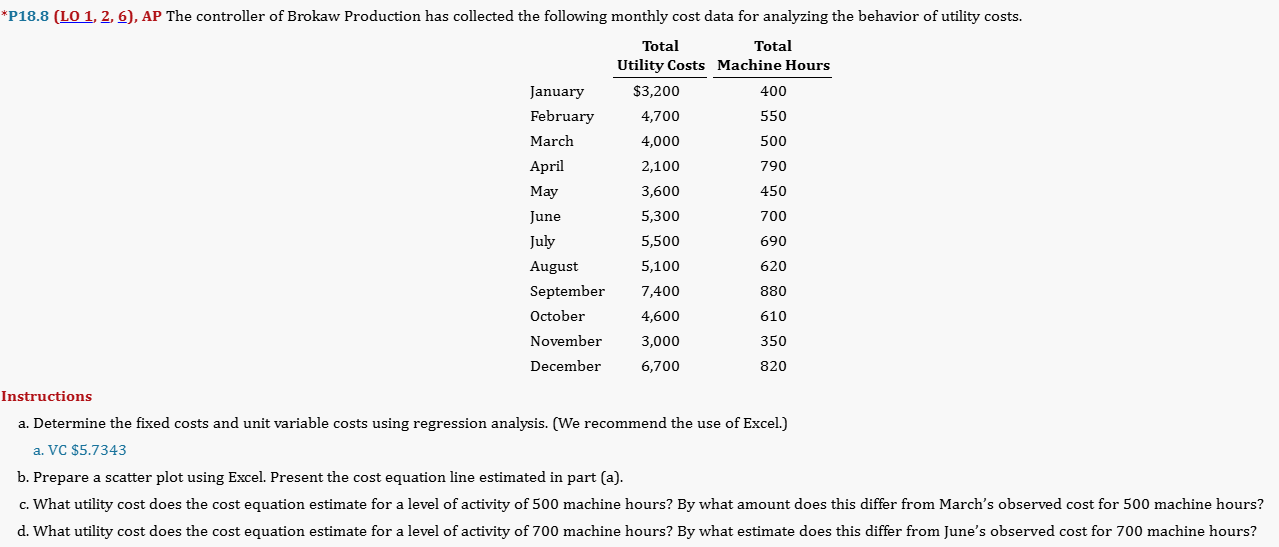
Question: * P 1 8 . 8 ( LO 1 , ( underline { 2 } , underline { 6 } )
PLO underlineunderline AP The controller of Brokaw Production has collected the following monthly cost data for analyzing the behavior of utility costs. Instructions a Determine the fixed costs and unit variable costs using regression analysis. We recommend the use of Excel. a VC $ b Prepare a scatter plot using Excel. Present the cost equation line estimated in part a c What utility cost does the cost equation estimate for a level of activity of machine hours? By what amount does this differ from March's observed cost for machine hours? d What utility cost does the cost equation estimate for a level of activity of machine hours? By what estimate does this differ from June's observed cost for machine hours?
Step by Step Solution
There are 3 Steps involved in it
1 Expert Approved Answer
Step: 1 Unlock

Question Has Been Solved by an Expert!
Get step-by-step solutions from verified subject matter experts
Step: 2 Unlock
Step: 3 Unlock