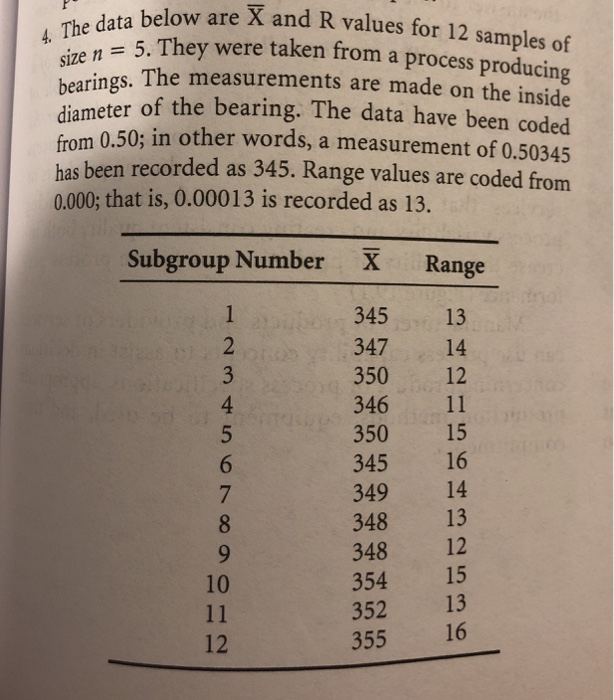
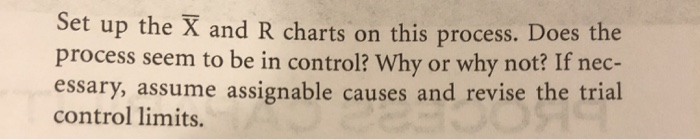
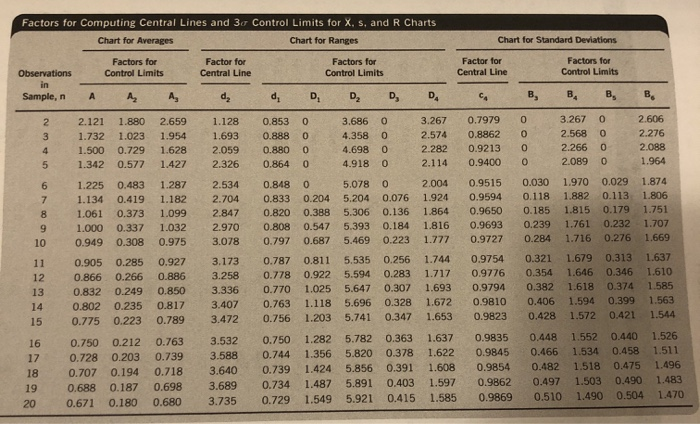
Question: P 4. The data below bearings. The measurem below are X and R values for 12 samples of hey were taken from a process producing

P 4. The data below bearings. The measurem below
P 4. The data below bearings. The measurem below are X and R values for 12 samples of hey were taken from a process producing vize n = 5. They were taken from an s. The measurements are made on the inside diameter of the bearing. The data have been coded from 0.50; in other words, a measurement of 0.50345 has been recorded as 345. Range values are coded from 0.000; that is, 0.00013 is recorded as 13. Subgroup Number & Range 13 2 345 347 350 346 350 345 349 348 348 354 11 12 352 355 16 Set up the X and R charts on this process. Does the process seem to be in control? Why or why not? If nec- essary, assume assignable causes and revise the trial control limits. Factors for Computing Central Lines and 30 Control Limits for X, s, and R Charts Chart for Averages Chart for Ranges Chart for Standard Deviations Factors for Control Limits Factor for Central Line Factors for Control Limits Observations Factor for Central Line Factors for Control Limits Sample, n A A A , B, B B , B, 2.121 1.732 1.500 1.342 1.880 2.659 1.023 1.954 0.7291.628 0.577 1.427 1.128 1.693 2.059 2.326 2.534 2.704 2.847 2.970 3.078 1.225 0.483 1.134 0.419 1.061 0.373 1.000 0.337 0.949 0.308 0.905 0.285 0.866 0.266 0.832 0.249 0.802 0.235 0.775 0.223 0.750 0.212 0.728 0.203 0.707 0.194 0.688 0.187 0.671 0.180 d, DDD, D. 0.8530 3.686 0 3.267 0.79790 0.888 0 4 .358 0 2 .574 0.8862 0 0.880 0 4.698 0 2.282 0.92130 0.864 0 4.918 0 2.114 0.94000 0.848 0 5 .078 0 2 .004 0.9515 0.833 0.204 5.204 0.076 1.924 0.9594 0.820 0.388 5.306 0.136 1.864 0.9650 0.808 0.547 5.393 0.184 1.816 0.9693 0.797 0.687 5.4690.223 1.7770 .9727 0.787 0.787 0811 0.811 5.535 0.256 1.744 0.9754 0.778 0.922 5.594 0.283 1.717 0.9776 0.770 1.025 5.647 0.307 1.693 0.9794 0.763 1.118 5.696 0.328 1.672 0.9810 0.756 1.203 5.741 0.347 1.653 0.9823 0.750 1.282 5.782 0.363 1.637 0.9835 0.744 0.744 1.356 1.356 5.820 5.820 0.3 0.378 1.622 0.9845 0.739 1.424 5.856 0.391 1.608 0.9854 0.734 1.487 5.891 0.403 1.597 0.9862 0.729 1.549 5.921_0.415 1.585 0.9869 1.287 1.182 1.099 1.032 0.975 0.927 0.886 0.850 0.817 0.789 0.763 0.739 0.718 0.698 0.680 12 3.267 0 2.606 2 .568 0 2 .276 2.266 0 2 .088 2.089 0 1.964 0.030 1.970 0.029 1.874 0.118 1.882 0.113 1.806 0.185 1.815 0.179 1.751 0.239 1.761 0.232 1.707 0.284 1.716 0.276 1.669 0.321 1.679 0.313 1.637 0.354 1.646 0.346 1.610 0.382 1.618 0.374 1.585 0.406 1.594 0.399 1.563 0.428 1.572 0.421 1.544 0.448 1.552 0.440 1.526 0.466 1.534 0.458 1.511 0.482 1.518 0.475 1.496 0.497 1.503 0.490 1.483 0.510 1.490 0.504 1470 3.173 3.258 3.336 3.407 3.472 16 17 3.532 3.588 3.588 3.640 3.689 3.735 20

Step by Step Solution

There are 3 Steps involved in it

1 Expert Approved Answer
Step: 1 Unlock blur-text-image
Question Has Been Solved by an Expert!

Get step-by-step solutions from verified subject matter experts

Step: 2 Unlock
Step: 3 Unlock

Students Have Also Explored These Related General Management Questions!