

Question: (a) Set up and R chart on this process. Does the process seem to be in statistical control? If necessary, revise the trial control limits.
(a) Set up and R chart on this process. Does the process seem to be in statistical control? If necessary, revise the trial control limits.
(b) If the specification on this diameter are 34.502.10, then find the percentage of nonconforming bearings produced by this process.
(c) What are the values of Cp and Cpk index?
(d) What are the natural tolerance limits of the process?
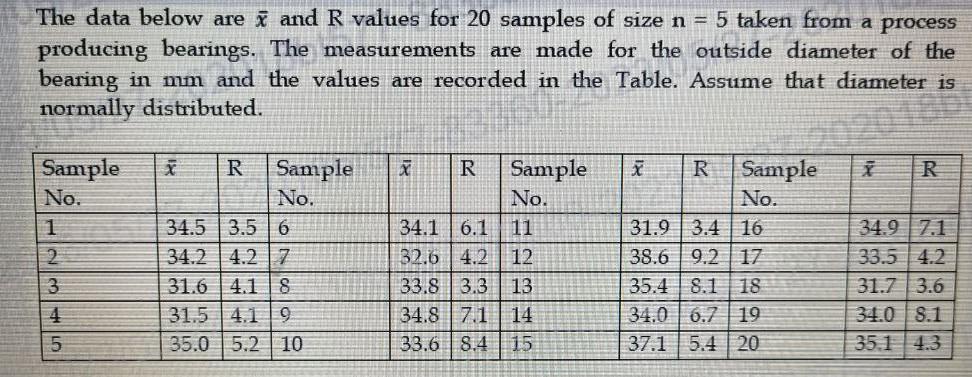
The data below are x and R values for 20 samples of size n=5 taken from a process producing bearings. The measurements are made for the outside diameter of the bearing in mm and the values are recorded in the Table. Assume that diameter is normally distributed
Step by Step Solution
There are 3 Steps involved in it
1 Expert Approved Answer
Step: 1 Unlock

Question Has Been Solved by an Expert!
Get step-by-step solutions from verified subject matter experts
Step: 2 Unlock
Step: 3 Unlock