

Question: P 8 - 4 Given the survey data shown in Figure P 8 - 4 . establish contour lines at a 5 ' contour interval.
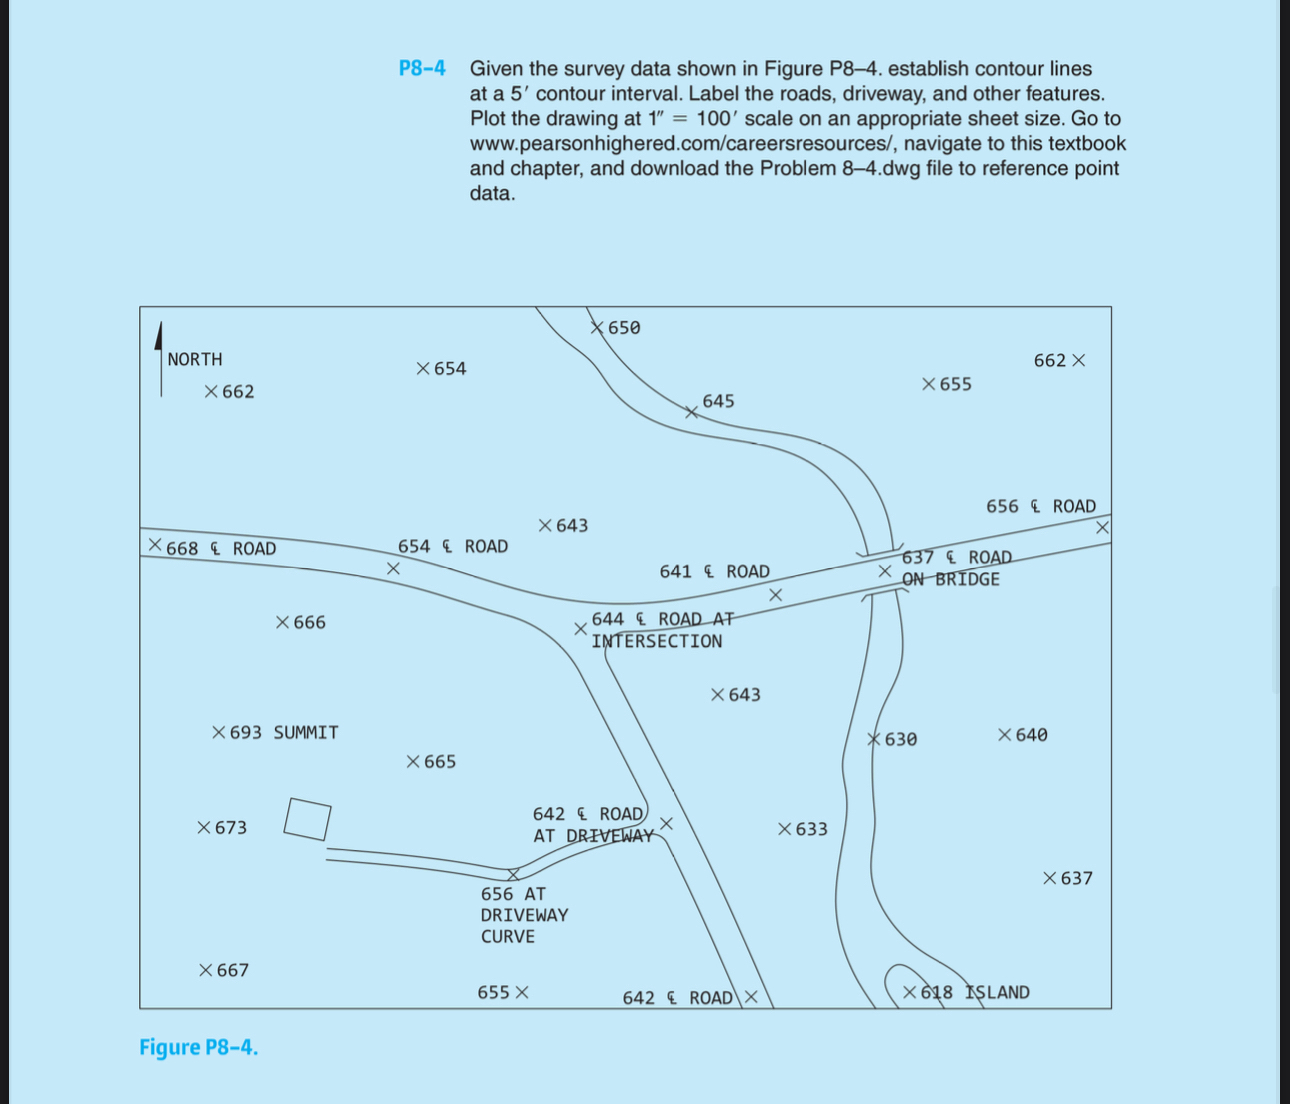
P Given the survey data shown in Figure P establish contour lines at a contour interval. Label the roads, driveway, and other features. Plot the drawing at scale on an appropriate sheet size. Go to
wwwpearsonhighered.comcareersresources navigate to this textbook and chapter, and download the Problem dwg file to reference point data.
Figure P
Step by Step Solution
There are 3 Steps involved in it
1 Expert Approved Answer
Step: 1 Unlock

Question Has Been Solved by an Expert!
Get step-by-step solutions from verified subject matter experts
Step: 2 Unlock
Step: 3 Unlock