

Question: P . S . Whitfield et al . , Solid State lonics 1 8 1 ( 2 0 1 0 ) 7 4 0 suggested
PS Whitfield et al Solid State lonics suggested the following phase
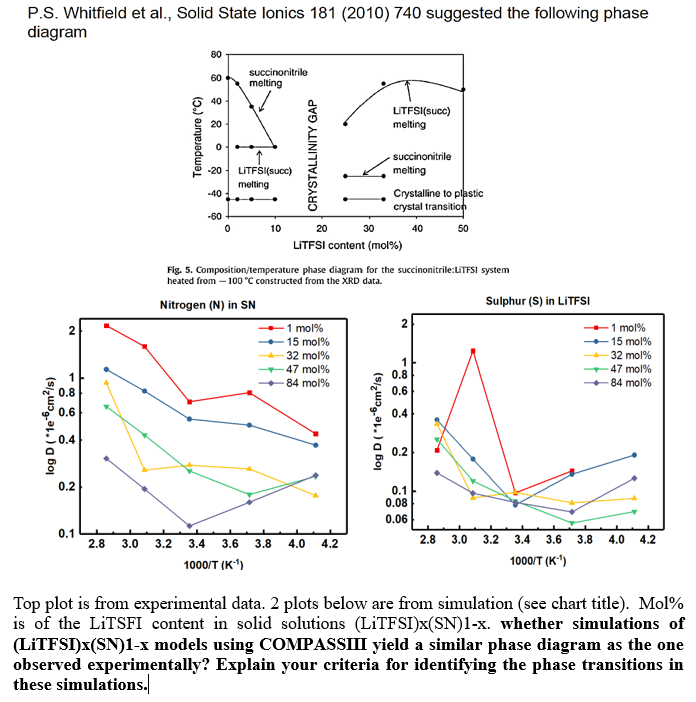
diagram
Fig. Compositiontemperature phase diagram for the succinonitrile:LiTFSI system
heated from constructed from the XRD data.
Top plot is from experimental data. plots below are from simulation see chart title Mol
is of the LiTSFI content in solid solutions LiTFSIxSNx whether simulations of
LiTFSIxSNx models using COMPASSIII yield a similar phase diagram as the one
observed experimentally? Explain your criteria for identifying the phase transitions in
these simulations.
Step by Step Solution
There are 3 Steps involved in it
1 Expert Approved Answer
Step: 1 Unlock

Question Has Been Solved by an Expert!
Get step-by-step solutions from verified subject matter experts
Step: 2 Unlock
Step: 3 Unlock