

Question: p The random variable T can be used to represent the length of time until the end of a service time or until the next
p
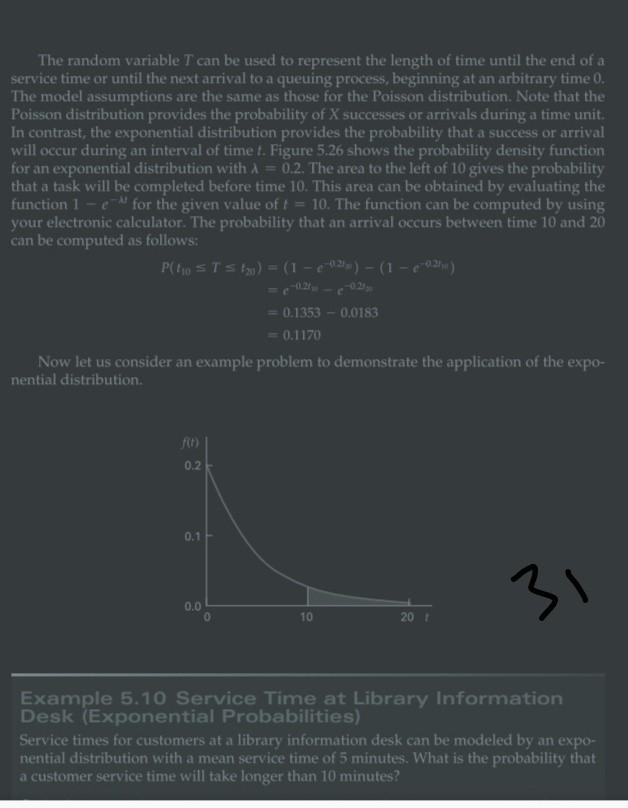
The random variable T can be used to represent the length of time until the end of a service time or until the next arrival to a queuing process, beginning at an arbitrary time 0. The model assumptions are the same as those for the Poisson distribution. Note that the Poisson distribution provides the probability of X successes or arrivals during a time unit. In contrast, the exponential distribution provides the probability that a success or arrival will occur during an interval of time t. Figure 5.26 shows the probability density function for an exponential distribution with 1 = 0.2. The area to the left of 10 gives the probability that a task will be completed before time 10. This area can be obtained by evaluating the function 1 - " for the given value of t = 10. The function can be computed by using your electronic calculator. The probability that an arrival occurs between time 10 and 20 can be computed as follows: P(110 ST s 13,0) = (1 - 12) - (1 - 0.29) = 0.1353 - 0,0183 = 0.1170 Now let us consider an example problem to demonstrate the application of the expo- nential distribution. 0.2 0.1 0.0 31 3 10 201 Example 5.10 Service Time at Library Information Desk (Exponential Probabilities) Service times for customers at a library information desk can be modeled by an expo- nential distribution with a mean service time of 5 minutes. What is the probability that a customer service time will take longer than 10 minutesStep by Step Solution
There are 3 Steps involved in it
1 Expert Approved Answer
Step: 1 Unlock

Question Has Been Solved by an Expert!
Get step-by-step solutions from verified subject matter experts
Step: 2 Unlock
Step: 3 Unlock