

Question: P12-2 Analyzing Comparative Financial Statements by Using Percentages and Selected Ratios LO12-5, 12-6, 12-7, 12-8 The comparative financial statements prepared at December 31, 2017, for
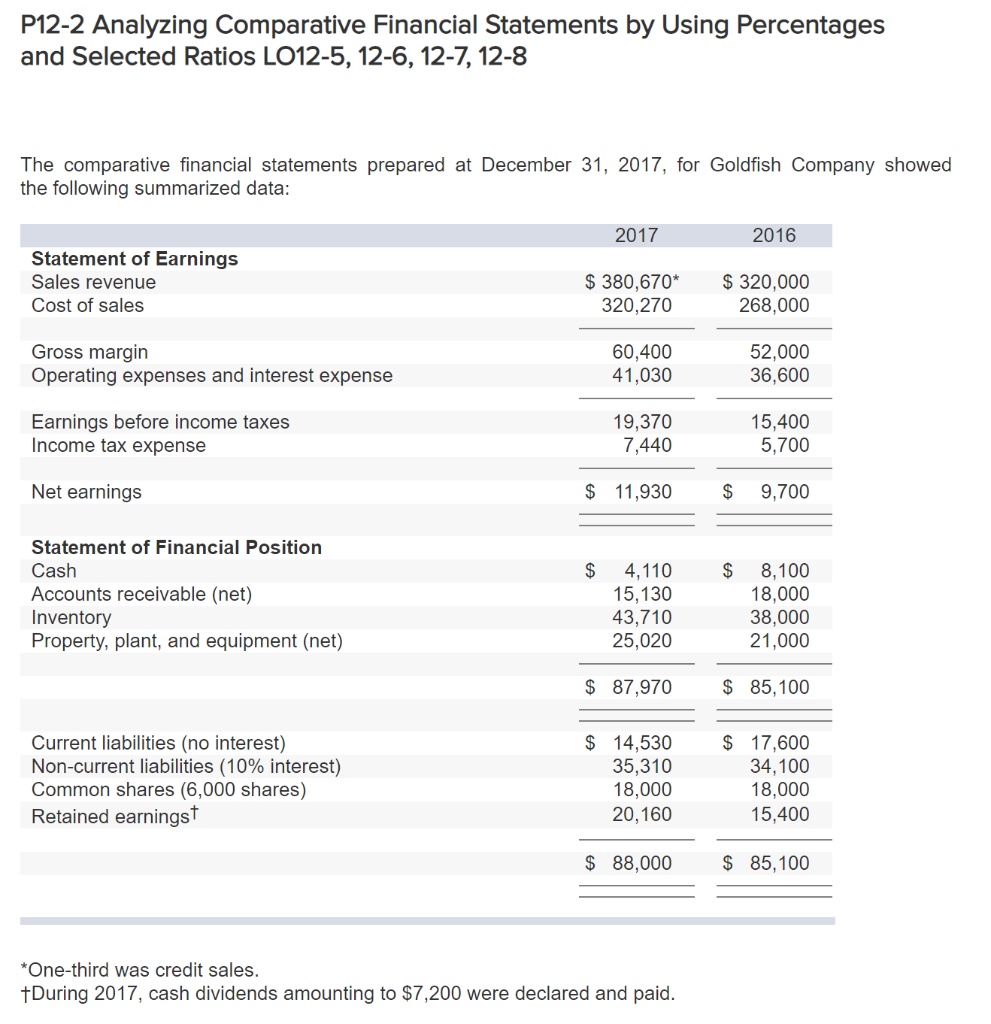
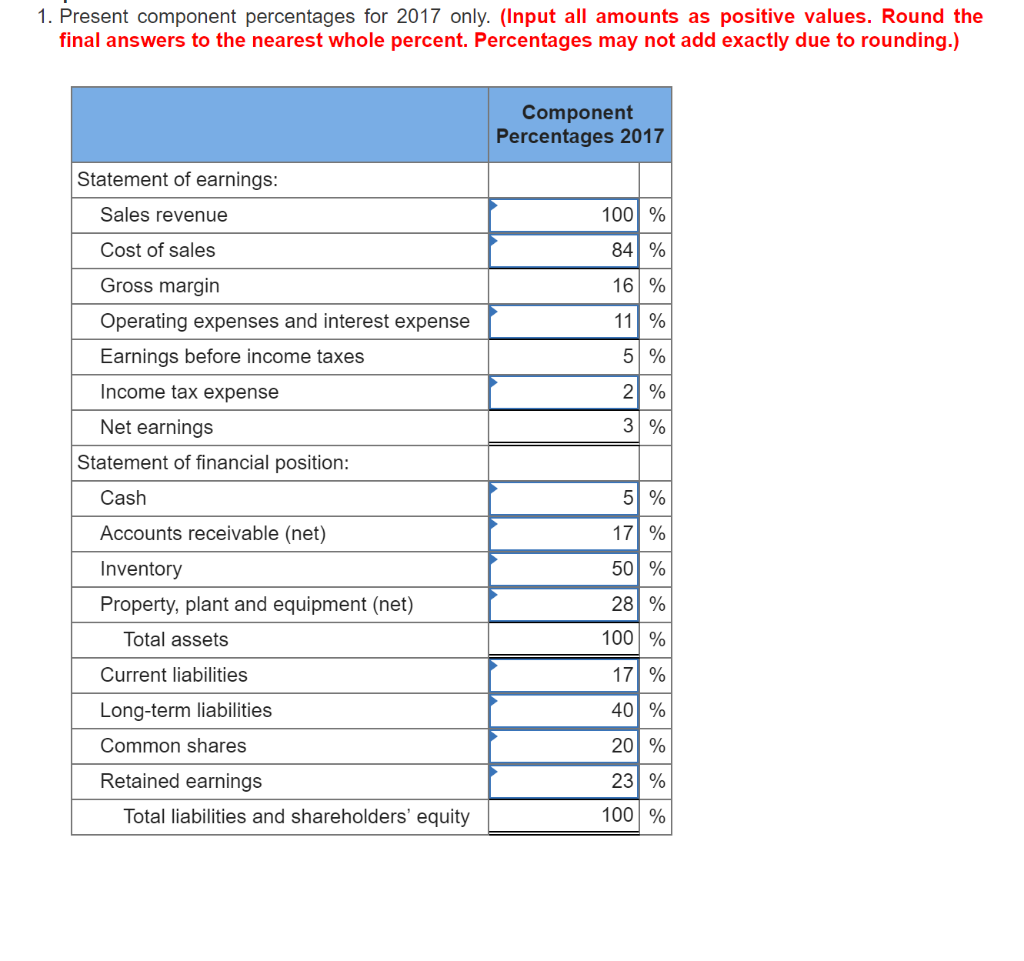
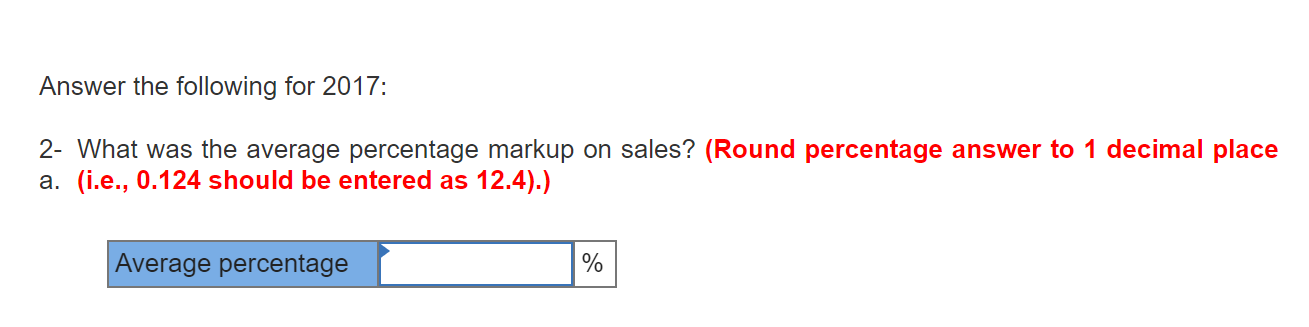
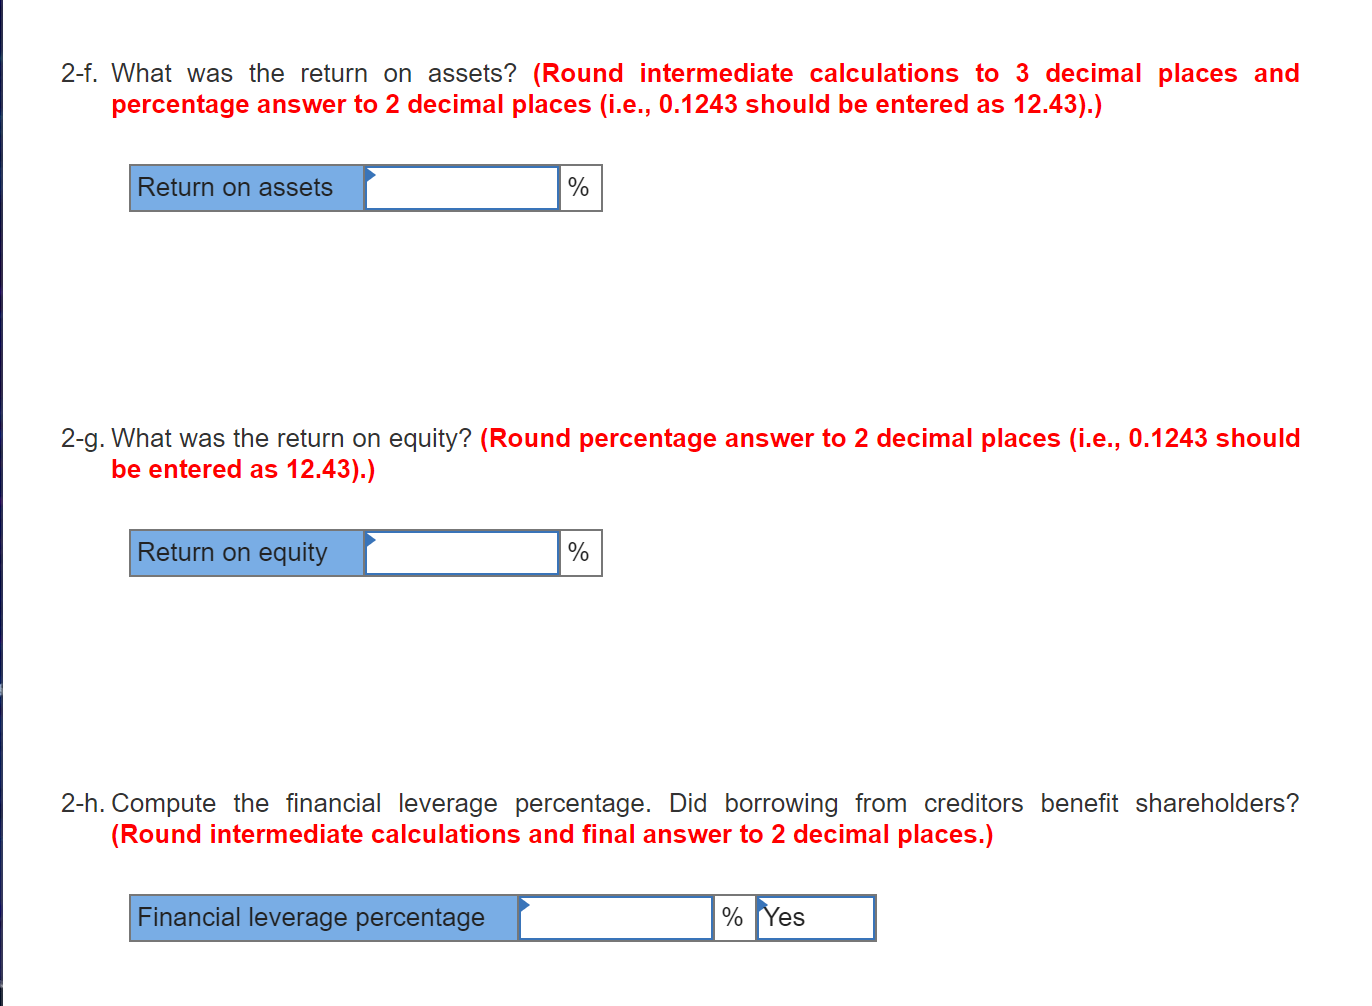
P12-2 Analyzing Comparative Financial Statements by Using Percentages and Selected Ratios LO12-5, 12-6, 12-7, 12-8 The comparative financial statements prepared at December 31, 2017, for Goldfish Company showed the following summarized data: 2017 2016 Statement of Earnings Sales revenue Cost of sales $ 380,670* 320,270 $ 320,000 268,000 Gross margin Operating expenses and interest expense 60,400 41,030 52,000 36,600 Earnings before income taxes Income tax expense 19,370 7,440 15,400 5,700 Net earnings $ 11,930 $ 9,700 $ $ Statement of Financial Position Cash Accounts receivable (net) Inventory Property, plant, and equipment (net) 4,110 15,130 43,710 25,020 8,100 18,000 38,000 21,000 $ 87,970 $ 85,100 Current liabilities (no interest) Non-current liabilities (10% interest) Common shares (6,000 shares) Retained earningst $ 14,530 35,310 18,000 20,160 $ 17,600 34,100 18,000 15,400 $ 88,000 $ 85,100 *One-third was credit sales. During 2017, cash dividends amounting to $7,200 were declared and paid. 1. Present component percentages for 2017 only. (Input all amounts as positive values. Round the final answers to the nearest whole percent. Percentages may not add exactly due to rounding.) Component Percentages 2017 Statement of earnings: Sales revenue 100 % Cost of sales 84 % 16 % Gross margin Operating expenses and interest expense Earnings before income taxes 11 % 5 % Income tax expense 2 % 31 % Net earnings Statement of financial position: Cash 50 % Accounts receivable (net) 171 % 50 % Inventory Property, plant and equipment (net) 28 % Total assets 100 % Current liabilities 171 % Long-term liabilities 401 % Common shares 20 % 23 % Retained earnings Total liabilities and shareholders' equity 100 % Answer the following for 2017: 2- What was the average percentage markup on sales? (Round percentage answer to 1 decimal place a. (i.e., 0.124 should be entered as 12.4).) Average percentage % 2-f. What was the return on assets? (Round intermediate calculations to 3 decimal places and percentage answer to 2 decimal places (i.e., 0.1243 should be entered as 12.43).) Return on assets % 2-g. What was the return on equity? (Round percentage answer to 2 decimal places (i.e., 0.1243 should be entered as 12.43).) Return on equity % 2-h. Compute the financial leverage percentage. Did borrowing from creditors benefit shareholders? (Round intermediate calculations and final answer to 2 decimal places.) Financial leverage percentage % Yes
Step by Step Solution
There are 3 Steps involved in it

Get step-by-step solutions from verified subject matter experts