Question: P12-8 (Static) Analyzing Financial Statements by Using Appropriate Ratios LO12-7, 12-8, 12-9, 12-10, 12-11 MTY Food Group Inc. is a Canadian franchisor and operator of
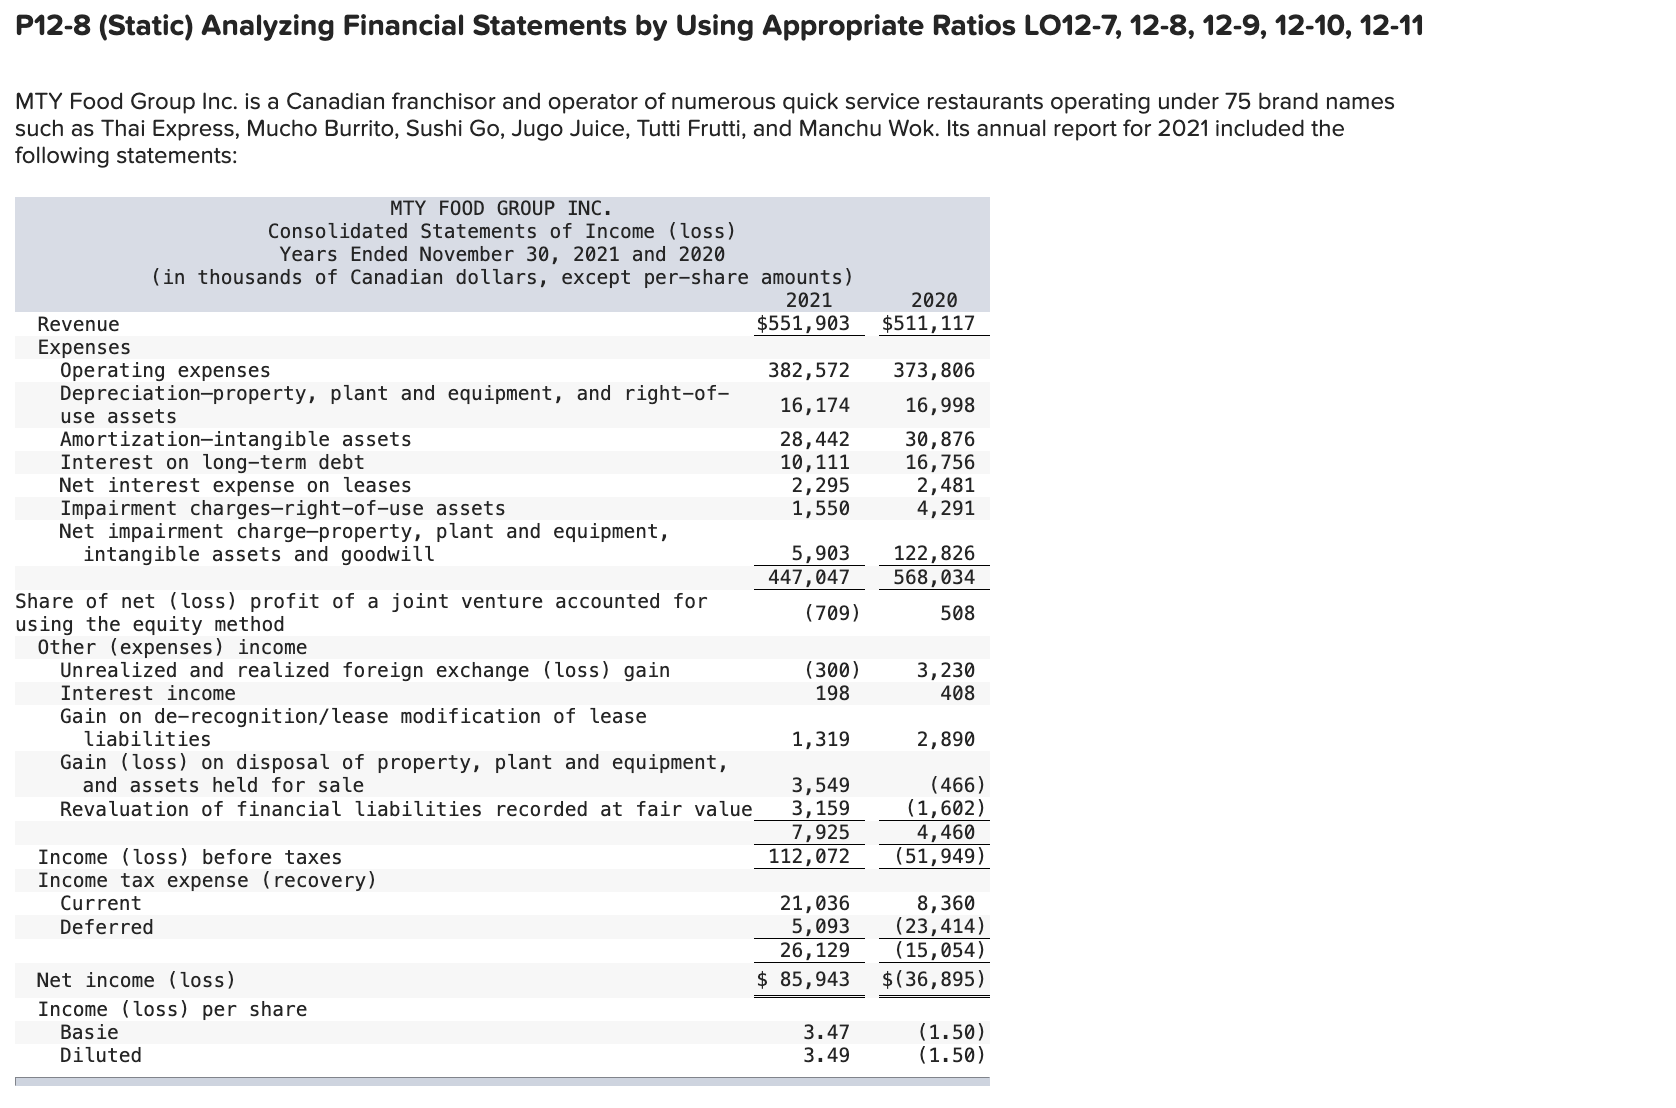
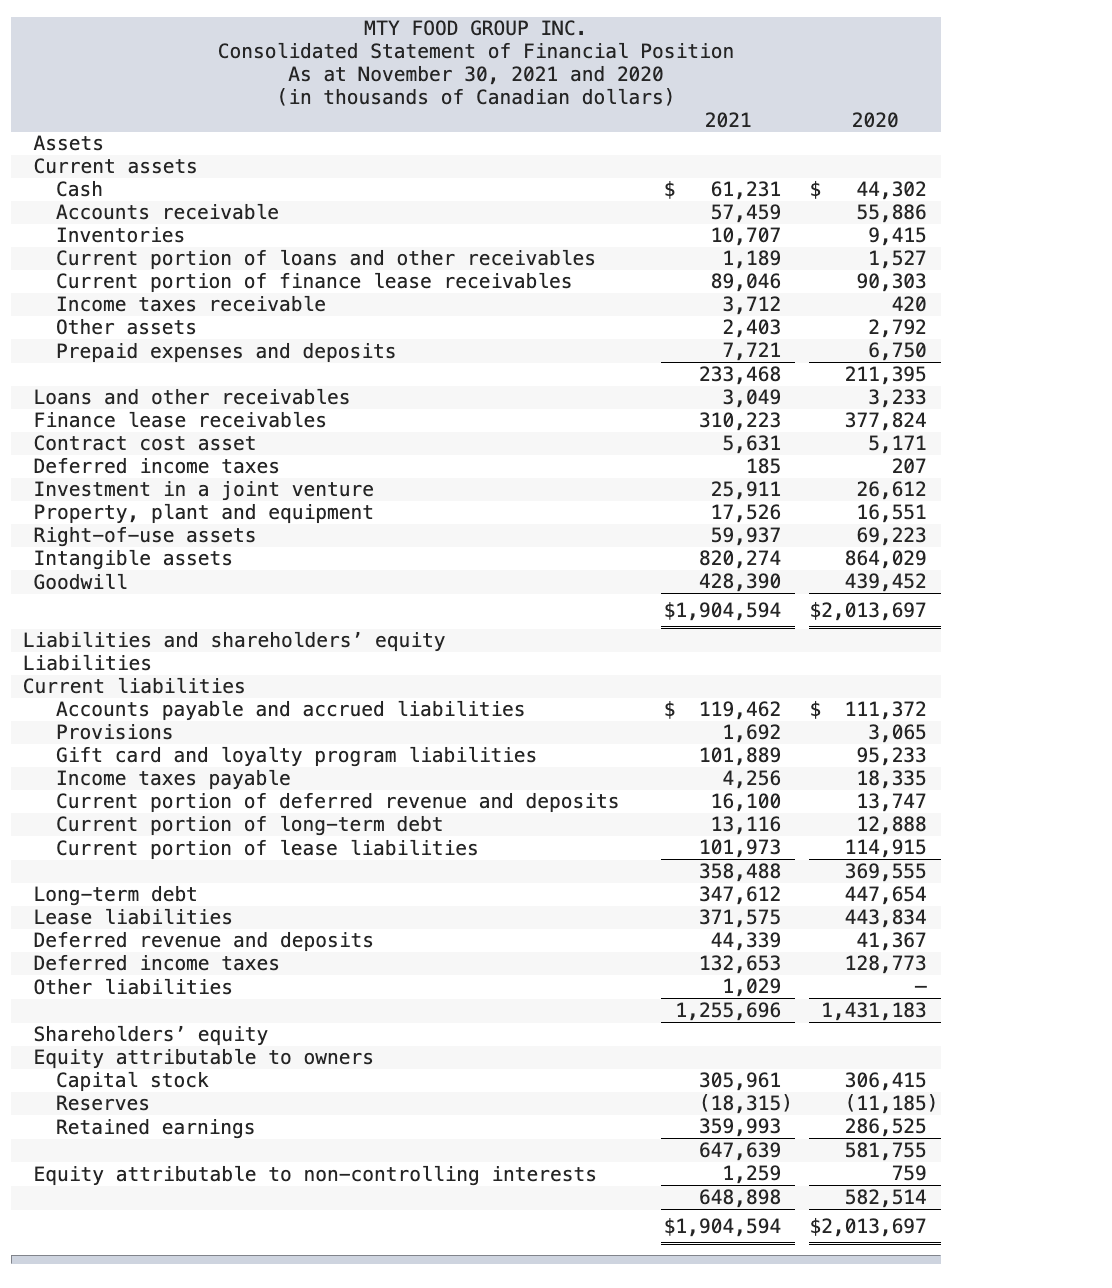
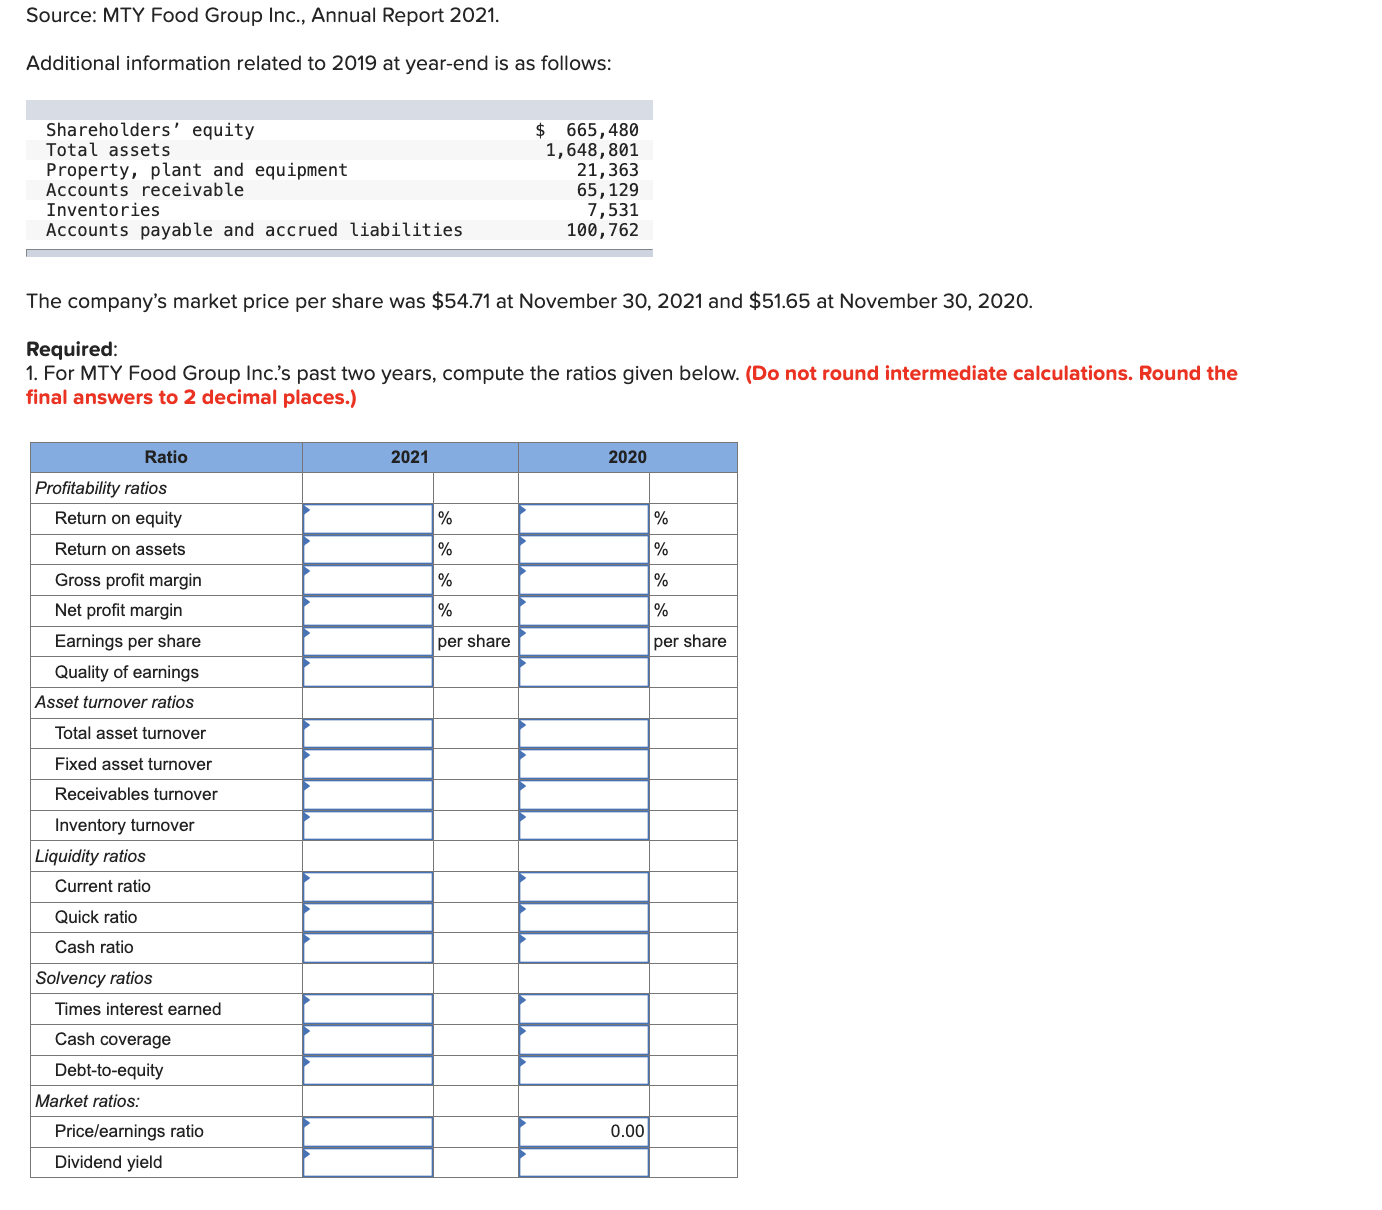
P12-8 (Static) Analyzing Financial Statements by Using Appropriate Ratios LO12-7, 12-8, 12-9, 12-10, 12-11 MTY Food Group Inc. is a Canadian franchisor and operator of numerous quick service restaurants operating under 75 brand names such as Thai Express, Mucho Burrito, Sushi 60, Jugo Juice. Tutti Frutti, and Manchu Wok. Its annual report for 2021 included the following statements: MTY FOOD GROUP INC. Consolidated Statements of Income (loss) Years Ended November 30, 2021 and 2020 (in thousands of Canadian dollars, except pershare amounts) 2021 2020 Revenue $551,903 $511,117 Expenses Operating expenses 382,572 373,806 Depreciationproperty, plant and equipment, and rightof use assets 16,174 16,998 Amortizationintangible assets 28,442 30,876 Interest on longterm debt 10,111 16,756 Net interest expense on leases 2,295 2,481 Impairment chargesrightofuse assets 1,550 4,291 Net impairment chargeproperty, plant and equipment, intangible assets and goodwill 5,903 122,826 447,047 568,034 Share of net (loss) profit of a joint venture accounted for (709) 508 using the equity method Other (expenses) income Unrealized and realized foreign exchange (loss) gain (300) 3,230 Interest income 198 408 Gain on derecognition/lease modification of lease liabilities 1,319 2,890 Gain (loss) on disposal of property, plant and equipment, and assets held for sale 3,549 (456) Revaluation of financial liabilities recorded at fair value 3,159 (1,602) 7,925 4,460 Income (loss) before taxes 112,072 (51,949) Income tax expense (recovery) Current 21,036 8,360 Deferred 5,093 (23,414) 26,129 (15,054) Net income (loss) $ 85,943 $(36,895) Income (loss) per share Basie 3.47 (1.50) Diluted 3.49 (1.50) MTY FOOD GROUP INC. Consolidated Statement of Financial Position As at November 30, 2021 and 2020 (in thousands of Canadian dollars} 2021 2020 Assets Current assets Cash $ 61,231 $ 44,302 Accounts receivable 57,459 55,886 Inventories 10,707 9,415 Current portion of loans and other receivables 1,189 1,527 Current portion of finance lease receivables 89,046 90,303 Income taxes receivable 3,712 420 Other assets 2,403 2,792 Prepaid expenses and deposits 7,721 6,750 233,468 211,395 Loans and other receivables 3,049 3,233 Finance lease receivables 310,223 377,824 Contract cost asset 5,631 5,171 Deferred income taxes 185 207 Investment in a joint venture 25,911 26,612 Property, plant and equipment 17,526 16,551 Rightofuse assets 59,937 69,223 Intangible assets 820,274 864,029 Goodwill 428,390 439,452 $1,904,594 $2,013,697 Liabilities and shareholders' equity Liabilities Current liabilities Accounts payable and accrued liabilities $ 119,462 $ 111,372 Provisions 1,692 3,065 Gift card and loyalty program liabilities 101,889 95,233 Income taxes payable 4,256 18,335 Current portion of deferred revenue and deposits 16,100 13,747 Current portion of longterm debt 13,116 12,888 Current portion of lease liabilities 101,973 114,915 358,488 369,555 Longterm debt 347,612 447,654 Lease liabilities 371,575 443,834 Deferred revenue and deposits 44,339 41,367 Deferred income taxes 132,653 128,773 Other liabilities 1,029 1,255,696 1,431,183 Shareholders' equity Equity attributable to owners Capital stock 305,961 306,415 Reserves (18,315) {11,185} Retained earnings 359,993 286,525 647,639 581,755 Equity attributable to noncontrolling interests 1,259 759 648,898 582,514 $1,904,594 $2,013,697 Source: MTY Food Group Inc., Annual Report 2021. Additional information related to 2019 at year-end is as follows: Shareholders' equity $ 665,430 Total assets 1,648,861 Property, plant and equipment 21,363 Accounts receivable 65,129 Inventories 7,531 Accounts payable and accrued liabilities 166,762 The company's market price per share was $54.71 at November 30, 2021 and $51.65 at November 30, 2020. Required: 1. For MTY Food Group lnc.'s past two years, compute the ratios given below. {Do not round Intermediate calculations. Round the final answers to 2 decimal places} Protabitity ratios Return on equity - - - -x / - Return on assets Gross prot margin Net prot margin Earnings per share Quality of earnings Asset turnover ratios Total asset turnover Fixed asset turnover Receivables turnover Inventory turnover Liquidity ratios Current ratio Quick ratio Cash ratio Solver: Cy ratios Times interest earned Cash coverage Debt-toequity Market ratios: Priceiearnings ratio Dividend yield
Step by Step Solution
There are 3 Steps involved in it
1 Expert Approved Answer
Step: 1 Unlock
Question Has Been Solved by an Expert!
Get step-by-step solutions from verified subject matter experts
Step: 2 Unlock
Step: 3 Unlock
Students Have Also Explored These Related Finance Questions!