

Question: PLEASE HELP P12-8 (Static) Analyzing Financial Statements by Using Appropriate Ratios LO12-7, 12-8, 12-9, 12-10, 1211 MTY Food Group Inc. is a Canadian franchisor and
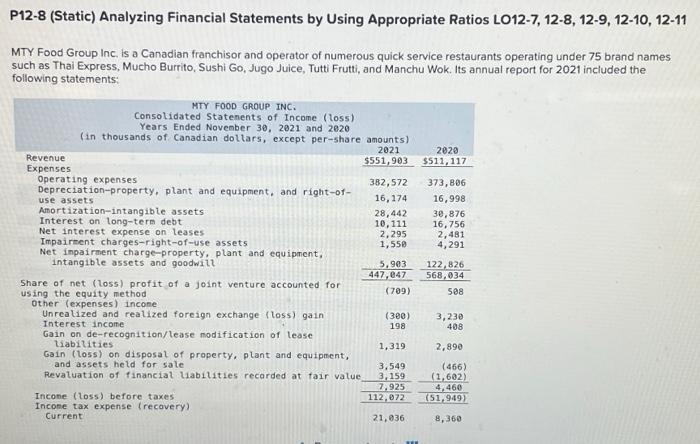
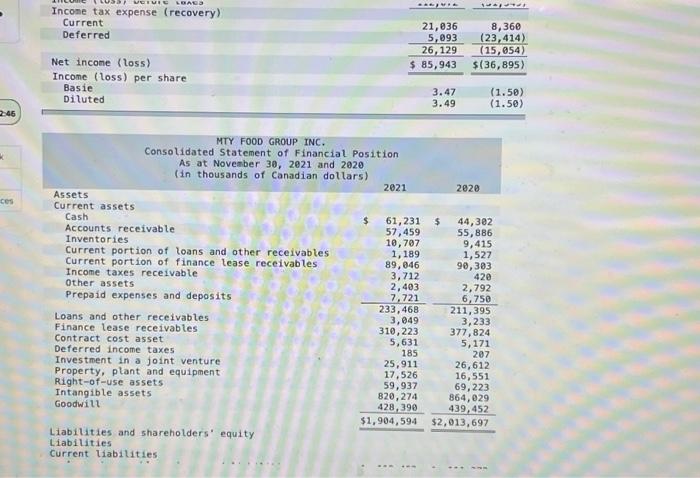
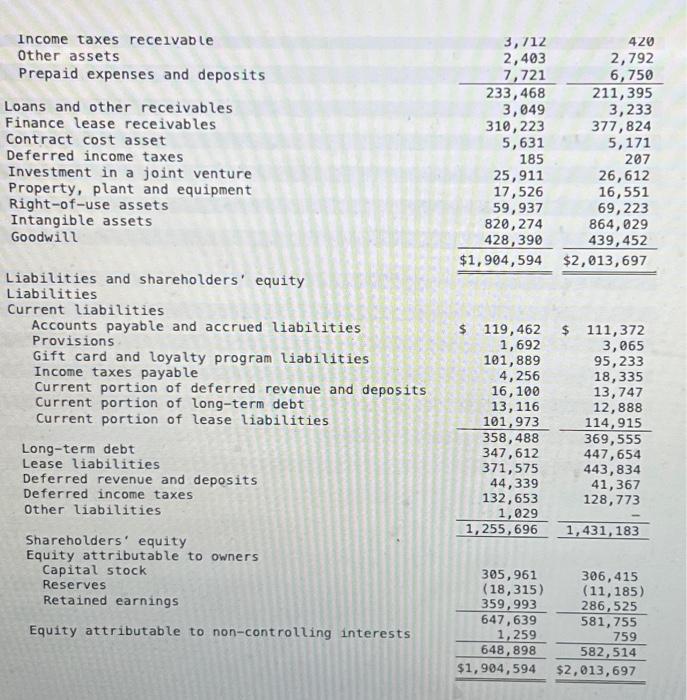
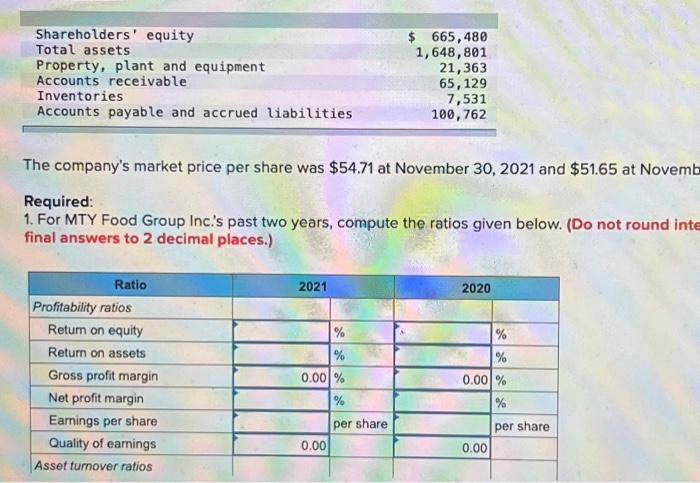
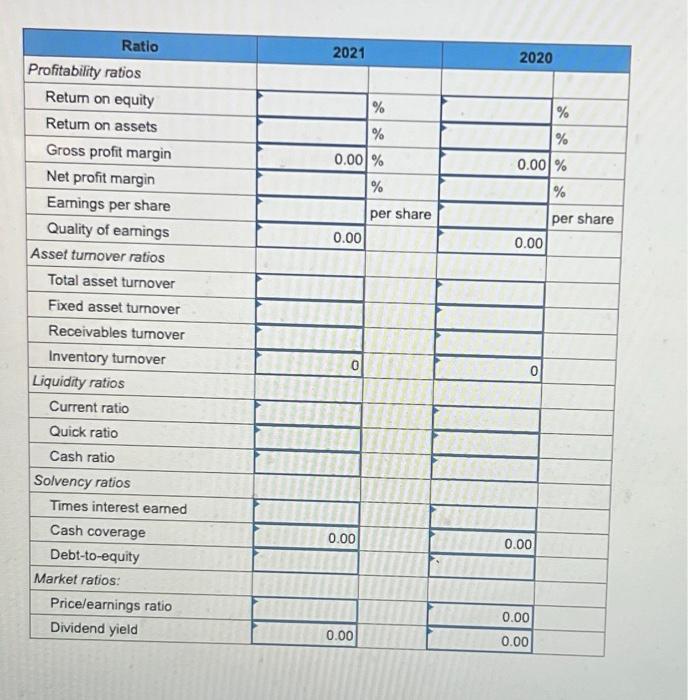
P12-8 (Static) Analyzing Financial Statements by Using Appropriate Ratios LO12-7, 12-8, 12-9, 12-10, 1211 MTY Food Group Inc. is a Canadian franchisor and operator of numerous quick service restaurants operating under 75 brand names such as Thai Express, Mucho Burrito, Sushi Go, Jugo Juice, Tutti Frutti, and Manchu Wok. Its annual report for 2021 included the following statements: \begin{tabular}{lrr} Incone tax expense (recovery) & 21,036 & 8,360 \\ Current & 5,093 & (23,414) \\ Deferred & (15,054)26,129 \\ Net income (loss) & $85,943 & $(36,895) \\ Income (loss) per share & & \\ Basie & 3.47 & (1.50) \\ Diluted & 3.49 & (1.50) \\ \hline \end{tabular} The company's market price per share was $54.71 at November 30,2021 and $51.65 at Novem Required: 1. For MTY Food Group Inc.'s past two years, compute the ratios given below. (Do not round inte final answers to 2 decimal places.) \begin{tabular}{|c|c|c|c|c|} \hline Ratio & \multicolumn{2}{|l|}{2021} & \multicolumn{2}{|l|}{2020} \\ \hline Profitability ratios & & & & 7 \\ \hline Retum on equity & & % & & % \\ \hline Return on assets & & % & & % \\ \hline Gross profit margin & 0.00 & % & 0.00 & % \\ \hline Net profit margin & & % & & % \\ \hline Earnings per share & & per share & 5 & per share \\ \hline Quality of earnings & 0.00 & & 0.00 & \\ \hline Asset turnover ratios & + & & & \\ \hline Total asset turnover & + & & & \\ \hline Fixed asset turnover & & & & \\ \hline Receivables tumover & & & & \\ \hline Inventory turnover & 0 & & 0 & \\ \hline Liquidity ratios & & & & \\ \hline Current ratio & & & & \\ \hline Quick ratio & & & 5 & \\ \hline Cash ratio & & & & \\ \hline Solvency ratios & & 11 & . & \\ \hline Times interest earned & U. & 7 & & \\ \hline Cash coverage & 0.00 & & 8 & \\ \hline Debt-to-equity & 4 & & 8 & \\ \hline Market ratios: & & 7 & Q & \\ \hline Price/earnings ratio & 7 & 7 & 0.00 & \\ \hline Dividend yield & 0.00 & ] & 0.00 & \\ \hline \end{tabular}
Step by Step Solution
There are 3 Steps involved in it

Get step-by-step solutions from verified subject matter experts