

Question: P18.1A (LO 2, 3) Writing Here are comparative statement data for Duke Company and Lord Company, two competitors. All balance sheet data are as of
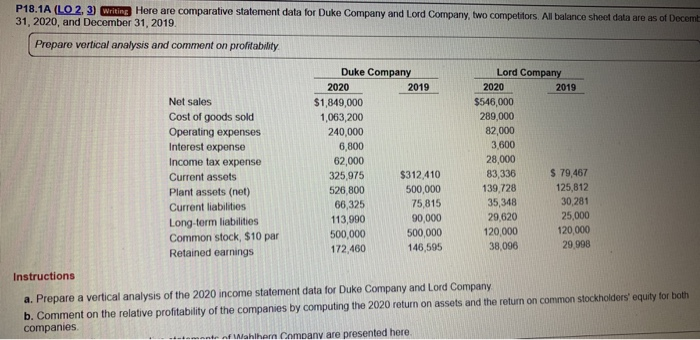
P18.1A (LO 2, 3) Writing Here are comparative statement data for Duke Company and Lord Company, two competitors. All balance sheet data are as of Decemb 31, 2020, and December 31, 2019. Prepare vertical analysis and comment on profitability Duke Company Lord Company 2020 2019 2020 2019 Net sales $1,849,000 1,063,200 $546,000 Cost of goods sold 289,000 Operating expenses Interest expense 82,000 240,000 3.600 6,800 28,000 Income tax expense 62,000 $ 79,467 $312,410 83,336 325,975 Current assets 125,812 139 728 500,000 526,800 Plant assets (net) 30,281 25,000 120,000 35,348 75,815 66,325 113,990 Current liabilities 29.620 90,000 Long-term liabilities Common stock, $10 par 120,000 500,000 500,000 29.998 38,096 146,595 172,460 Retained earnings Instructions b. Comment on the relative profitability of the companies by computing the 2020 return on assets and the return on common stockholders' equity for both companies. a. Prepare a vertical analysis of the 2020 income statement data for Duke Company and Lord Company nte of Wlahlhen Company are presented here
Step by Step Solution
There are 3 Steps involved in it

Get step-by-step solutions from verified subject matter experts