

Question: P2-50 i need the answer. LO1,3 P2-49. Comparing Operating Characteristics Across Industries Review the following selected income statement and balance sheet data for fiscal years
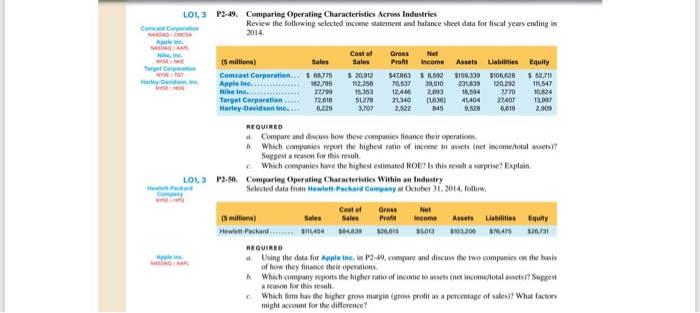
LO1,3 P2-49. Comparing Operating Characteristics Across Industries Review the following selected income statement and balance sheet data for fiscal years ending in 2014 Cost ef Gress Net Sales ProfitIncomeAssets Liabilities Equity 68775 20,912 $47863 8592 $159,339 $106/828 5271 0,537 39,510 231839 120,292 111,547 770 10824 51278 21340 ) 41404 2707 13997 Apple Ine. Nike Inc. 12,448 293 18,594 299 a. Compare and discuss how these companies finance their operatio b. Which companies report the highest ratio of income to assets (net income/iotal assets)? Suggest a reason for this result Which companies have the highest estimated ROE? Is this resalt a surprise? Explain LO1,3 P2.S0. Comparing Operating Characteristies Within an Industry Selected data from Hewlett-Packard Company at October 31, 2014, follow Cest of Gress Sales Sales Prefit Income Assets Liabilities Equity $111454$43 .15 $013$03208 45 $20731 Hewlett-Packard REQUIRED a. Using the data for Apple Ine.in P2-49, compare and discuss the two companies on the basis b. Which company reports the higher ratio of income to assets (net incomeotal assets) Suggest e Which firm has the higher gross margin (gross profit as a percentage of sales)? What factors Apple ine of how they finance their operations a reason for this result. might account for the difference
Step by Step Solution
There are 3 Steps involved in it

Get step-by-step solutions from verified subject matter experts