

Question: p2L Module 1 Assignment - CSC X D2l Module 1 Assignment - CSCZ X o (6 25 nationalu.brightspace.com/d2l/Ims/dropbox/user/folder_submit_files.d2I?ou=81515&isprv=0&db=438645&cfql=1 5. In a box plot, what percent
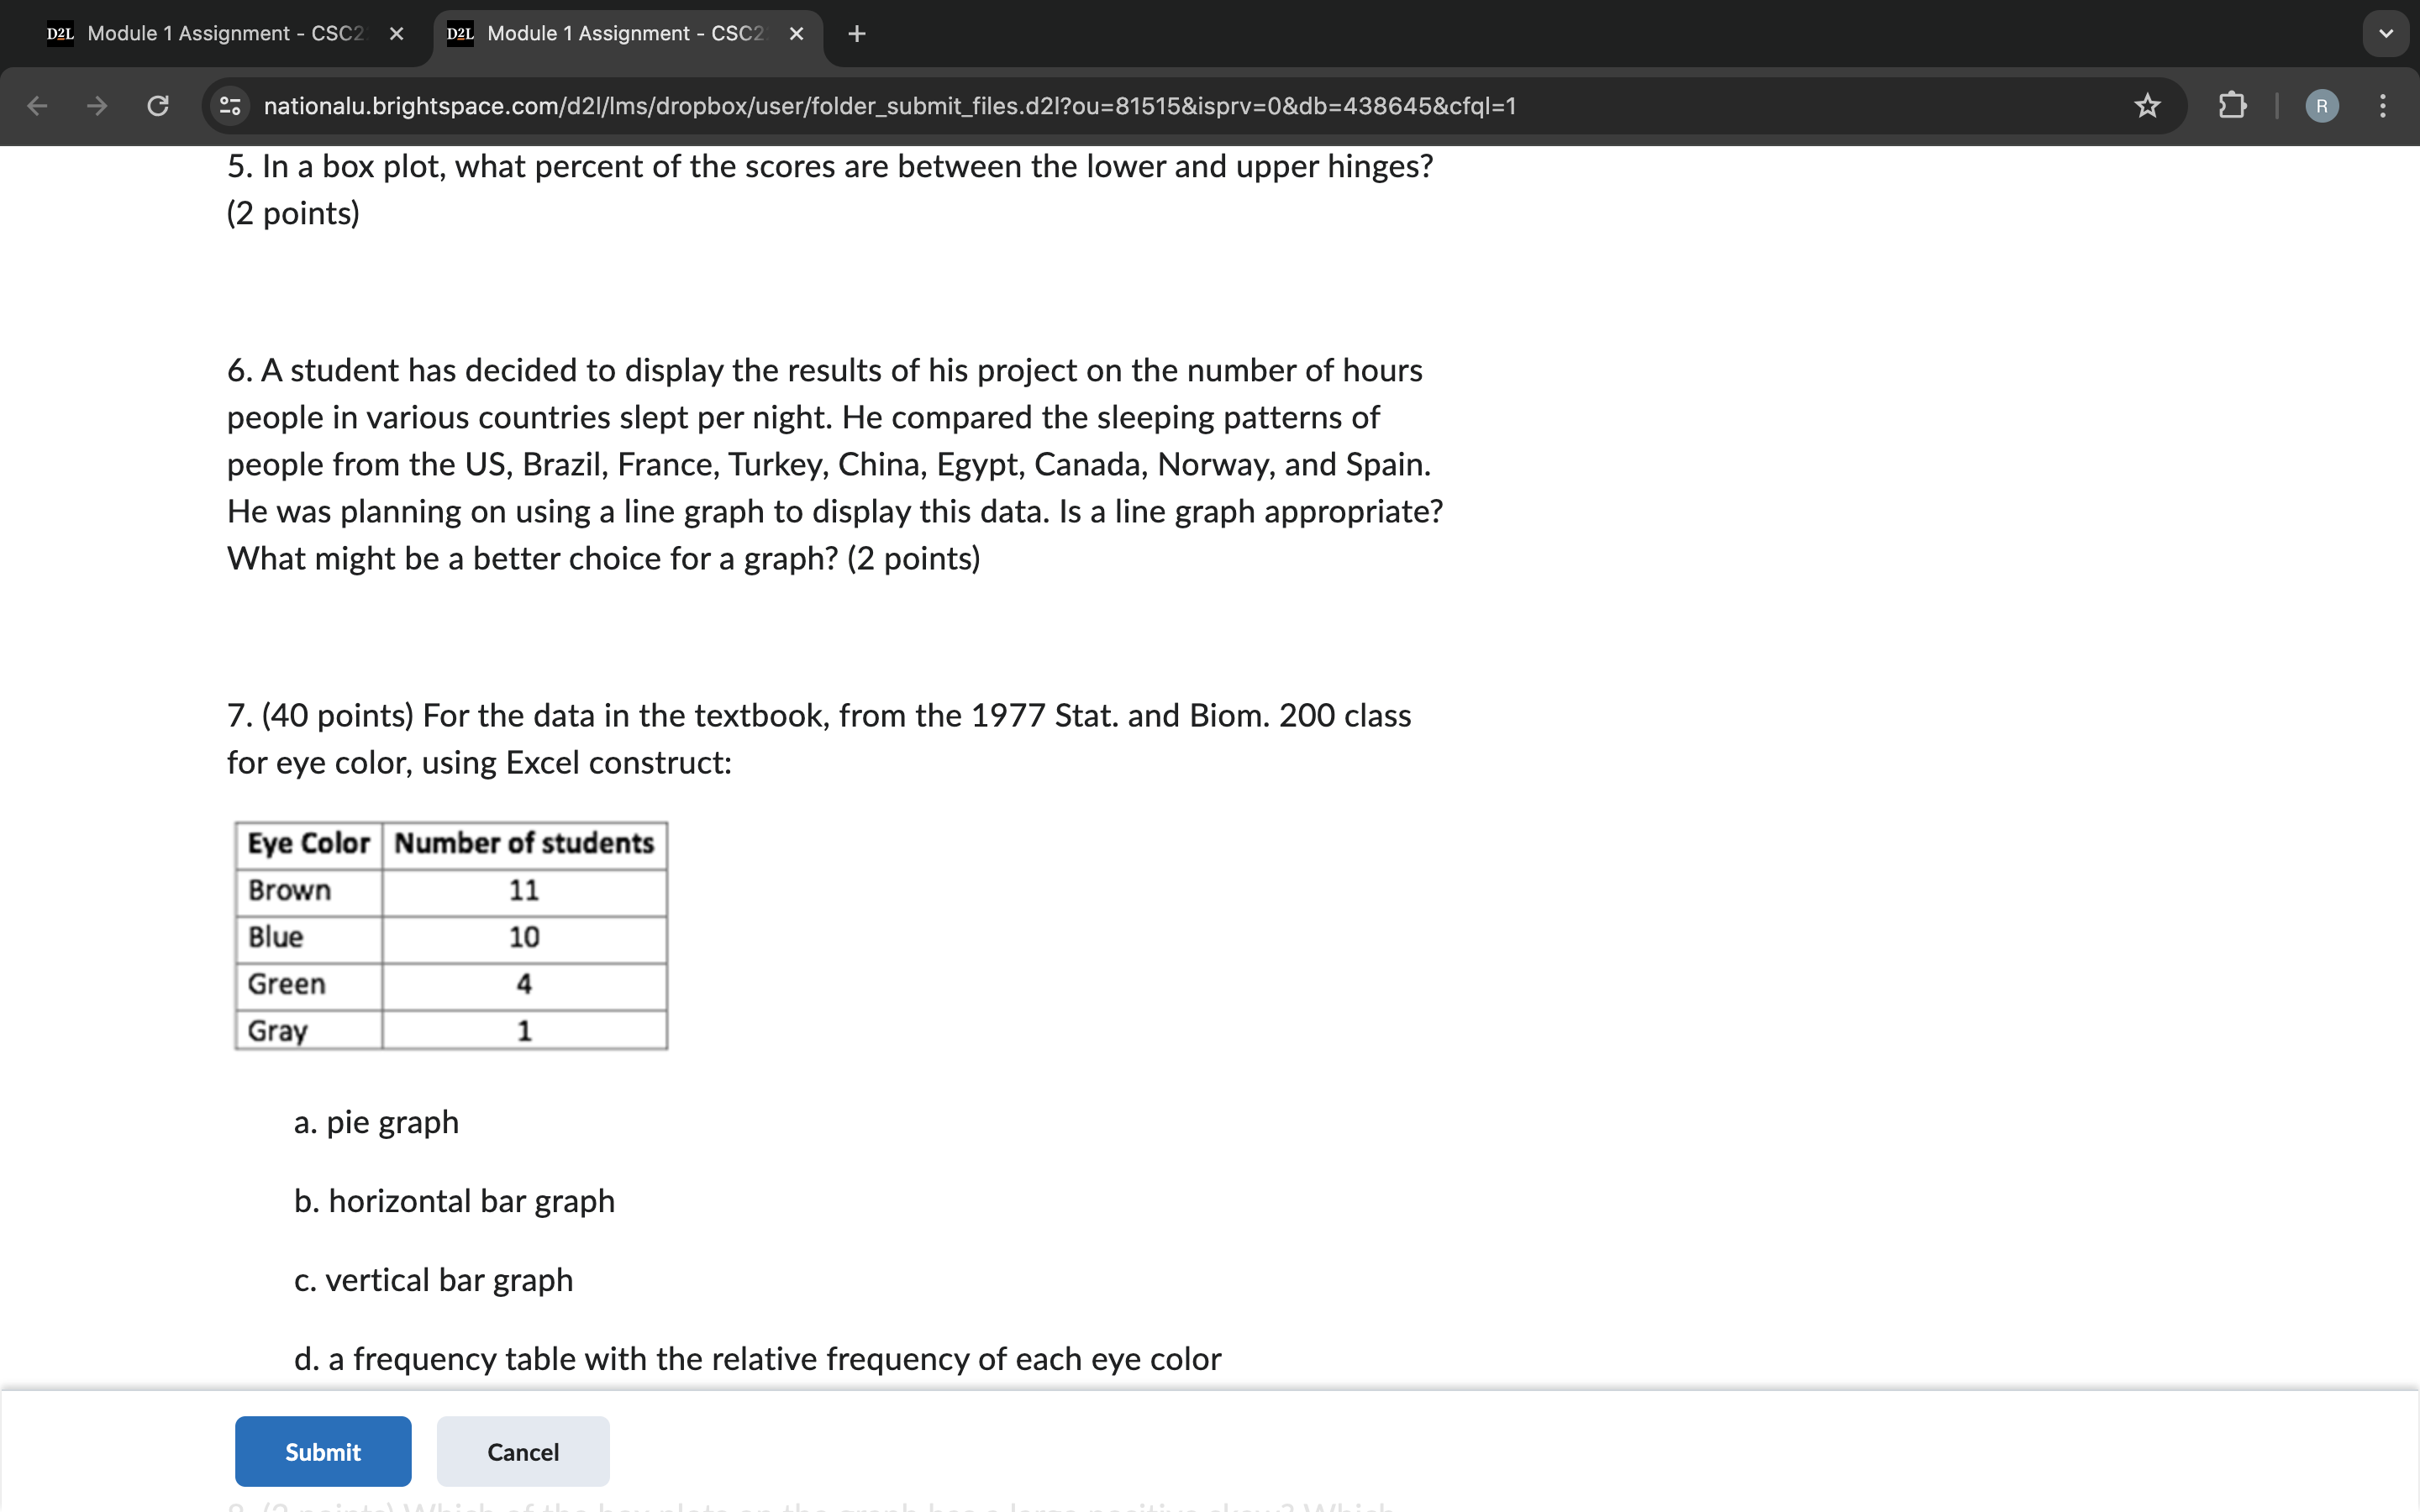
p2L Module 1 Assignment - CSC X D2l Module 1 Assignment - CSCZ X o (6 25 nationalu.brightspace.com/d2l/Ims/dropbox/user/folder_submit_files.d2I?ou=81515&isprv=0&db=438645&cfql=1 5. In a box plot, what percent of the scores are between the lower and upper hinges? (2 points) 6. A student has decided to display the results of his project on the number of hours people in various countries slept per night. He compared the sleeping patterns of people from the US, Brazil, France, Turkey, China, Egypt, Canada, Norway, and Spain. He was planning on using a line graph to display this data. Is a line graph appropriate? What might be a better choice for a graph? (2 points) 7. (40 points) For the data in the textbook, from the 1977 Stat. and Biom. 200 class for eye color, using Excel construct: [ Eye Color | Number of students | Brown 11 Blue 10 Green 4 Gray a. pie graph b. horizontal bar graph c. vertical bar graph d. a frequency table with the relative frequency of each eye color m Cancel
Step by Step Solution
There are 3 Steps involved in it

Get step-by-step solutions from verified subject matter experts