Question: P3 (25%). Modify the news vendor problem in Section 2.7.1 to use independent demands for each trial value of q, and note the difference in
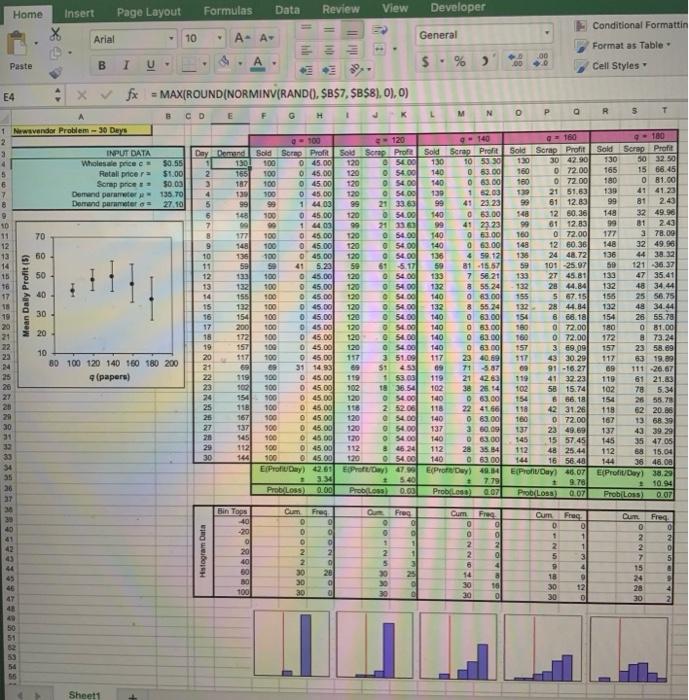
P3 (25%). Modify the news vendor problem in Section 2.7.1 to use independent demands for each trial value of q, and note the difference in the behavior of the output, particularly in the mean plot on the left. (Hint: carefully read the model in lecture 3-Newsvendor.xls posted on Canvas). P3: Independent demands for each trial means that you create a demand column for each trial. Note that in the file newsvendor.xls, there is only one demand column shared by five trials (five different q's). Home Insert Page Layout Formulas Data Review View Developer M Conditional Formattin Arial 10 A- A+ General Format as Table Paste B 1 A, $ . % 2 .00 Cell Styles E4 Xfx = MAX(ROUND(NORMINV(RANDO. $B$7, $B$8), O), 0) L M N o P R 5 G 160 180 BCD E F G H 1 J K 1 Newsvinder Problem - 30 Days 2 120 3 INPUT DATA Day Demand Sold Sore Profit Sold Scrap Pro Wholesale peces $0.55 150 100 0 45.00 120 @ 5400 5 Retall price $1.00 2 165 100 0 45.00 120 0 54.00 Scrap price 30.03 3 100 0 45.00 120 540 Demad parameter 138.70 4 130 100 0 45.00 120 SEO 8 Demand parameters 27.10 5 99 99 1 44 03 99 21 33.63 6 100 0 45.00 120 5400 10 7 00 1 403 99 21 3363 70 8 170 100 0 45.00 120 05400 12 9 100 4500 120 0 5400 13 60 10 135 100 0 45.00 120 0 54.00 14 11 59 41 5.23 50 61 5.17 15 50 12 133 100 0 45.00 120 0 54.00 To 13 132 100 45.00 120 54.00 17 40 14 155 100 0 45.00 120 54.00 18 15 132 100 0 45.00 120 30 0 54.00 16 154 100 0 45.00 120 0 54.00 17 200 20 100 045 DO 120 0 54.00 21 18 172 100 0 45.00 @ 54.00 19 157 10 100 0 45.00 120 0 54.00 20 117 100 0 45.00 117 24 80 100 120 140 150 180 200 3 51.00 21 59 69 31 14.83 89 $1 4.55 25 (papers) 119 100 D45.00 119 1 53 03 20 23 100 100 0 45.00 102 18 38.54 27 24 154 100 0 45.00 120 54.00 25 718 100 0 45.00 118 2.52.00 20 26 167 100 0 45.00 120 54.00 30 27 737 500 0 45.00 120 05400 31 145 100 0 45.00 0 5400 29 500 0 45.00 112 33 30 100 0 45.00 120 0 54.00 EfProfi Day) 42.01 EPowy) 47.99 35 5.40 26 Prob(Loss) 0.00 Prob Los 0.00 Mean Daily Profit (5) - 140 Sold Scrag Profit 130 10 53 30 140 083.00 140 0 63.00 130 12.03 99 41 23.23 140 0 63.00 99 41 2323 140 0 63.00 140 0 63.00 136 4 59.121 59 81 -15.57 133 7 58.21 132 8 55.24 140 0 63.00 132 8 55 24 140 0 63.00 140 03.001 140 0 63.00 140 0 63.00 117 23 40.50 09 119 21 42.63 102 38 25 14 140 63.001 118 22 41601 140 0 63.00 137 350.00 140 0 63.00 112 28 35 841 140 E{Profil Dwy) 49,04 7.79 Probios 007 9-100 Sold Sorap Profit Sold Senso Profit 130 30 42.90 130 50 32.50 160 0 72.00 165 15 68.45 160 0 72.00 0 81.00 21 51.63 139 41 41.23 99 61 12.83 99 81 2.43 14 12 50.36 148 32 49.90 99 61 12.83 99 2.43 160 0 72.00 177 378.00 148 12 60.36 148 32 49.90 138 24 48.72 136 44 38.32 59 101 -25.97 50 121 -36.37 133 27 45.81 133 47 35.41 28 44.84 132 48 3444 155 567.15 156 25 56.75 132 28 44.84 132 48 34.44 156 668.18 154 2655.78 180 0 72.00 180 0 81.00 160 0 72.00 172 8 73.24 157 3 69.09 157 23 58.89 917 43 30.29 117 63 19.09 69 91 -16.27 69 111 -26.67 41 32.23 119 61 21.83 102 58 15.74 102 78 5.34 154 6 56.18 154 26 55.78 118 42 31.26 118 62 20.86 160 0 72.00 167 13 58 39 137 23 49.69 137 43 39 29 145 15 57.45 145 35 47.08 112 48 25.44 112 58 15.04 16 56.48 38 46.00 E(ProDay45.07 E(Profit/Day 30,20 9.78 10.94 Prob(Loss) 0.07 ProbiLoss) 0.07 110 cum Fres Fres Free Bin Tops 40 20 O 20 0 0 : Histogram Data 0 O 0 2 o 20 . 1 2 5 30 2 2 30 30 30 Cum 0 0 2 2 6 14 30 20 1 1 3 25 c Cum Free D 0 1 1 2 1 5 3 9 4 18 9 30 12 30 D 3888 Free 0 0 2 2 2 7 5 15 24 28 4 30 2 4 8 16 0 47 4 50 51 53 54 55 Sheet1 P3 (25%). Modify the news vendor problem in Section 2.7.1 to use independent demands for each trial value of q, and note the difference in the behavior of the output, particularly in the mean plot on the left. (Hint: carefully read the model in lecture 3-Newsvendor.xls posted on Canvas). P3: Independent demands for each trial means that you create a demand column for each trial. Note that in the file newsvendor.xls, there is only one demand column shared by five trials (five different q's). Home Insert Page Layout Formulas Data Review View Developer M Conditional Formattin Arial 10 A- A+ General Format as Table Paste B 1 A, $ . % 2 .00 Cell Styles E4 Xfx = MAX(ROUND(NORMINV(RANDO. $B$7, $B$8), O), 0) L M N o P R 5 G 160 180 BCD E F G H 1 J K 1 Newsvinder Problem - 30 Days 2 120 3 INPUT DATA Day Demand Sold Sore Profit Sold Scrap Pro Wholesale peces $0.55 150 100 0 45.00 120 @ 5400 5 Retall price $1.00 2 165 100 0 45.00 120 0 54.00 Scrap price 30.03 3 100 0 45.00 120 540 Demad parameter 138.70 4 130 100 0 45.00 120 SEO 8 Demand parameters 27.10 5 99 99 1 44 03 99 21 33.63 6 100 0 45.00 120 5400 10 7 00 1 403 99 21 3363 70 8 170 100 0 45.00 120 05400 12 9 100 4500 120 0 5400 13 60 10 135 100 0 45.00 120 0 54.00 14 11 59 41 5.23 50 61 5.17 15 50 12 133 100 0 45.00 120 0 54.00 To 13 132 100 45.00 120 54.00 17 40 14 155 100 0 45.00 120 54.00 18 15 132 100 0 45.00 120 30 0 54.00 16 154 100 0 45.00 120 0 54.00 17 200 20 100 045 DO 120 0 54.00 21 18 172 100 0 45.00 @ 54.00 19 157 10 100 0 45.00 120 0 54.00 20 117 100 0 45.00 117 24 80 100 120 140 150 180 200 3 51.00 21 59 69 31 14.83 89 $1 4.55 25 (papers) 119 100 D45.00 119 1 53 03 20 23 100 100 0 45.00 102 18 38.54 27 24 154 100 0 45.00 120 54.00 25 718 100 0 45.00 118 2.52.00 20 26 167 100 0 45.00 120 54.00 30 27 737 500 0 45.00 120 05400 31 145 100 0 45.00 0 5400 29 500 0 45.00 112 33 30 100 0 45.00 120 0 54.00 EfProfi Day) 42.01 EPowy) 47.99 35 5.40 26 Prob(Loss) 0.00 Prob Los 0.00 Mean Daily Profit (5) - 140 Sold Scrag Profit 130 10 53 30 140 083.00 140 0 63.00 130 12.03 99 41 23.23 140 0 63.00 99 41 2323 140 0 63.00 140 0 63.00 136 4 59.121 59 81 -15.57 133 7 58.21 132 8 55.24 140 0 63.00 132 8 55 24 140 0 63.00 140 03.001 140 0 63.00 140 0 63.00 117 23 40.50 09 119 21 42.63 102 38 25 14 140 63.001 118 22 41601 140 0 63.00 137 350.00 140 0 63.00 112 28 35 841 140 E{Profil Dwy) 49,04 7.79 Probios 007 9-100 Sold Sorap Profit Sold Senso Profit 130 30 42.90 130 50 32.50 160 0 72.00 165 15 68.45 160 0 72.00 0 81.00 21 51.63 139 41 41.23 99 61 12.83 99 81 2.43 14 12 50.36 148 32 49.90 99 61 12.83 99 2.43 160 0 72.00 177 378.00 148 12 60.36 148 32 49.90 138 24 48.72 136 44 38.32 59 101 -25.97 50 121 -36.37 133 27 45.81 133 47 35.41 28 44.84 132 48 3444 155 567.15 156 25 56.75 132 28 44.84 132 48 34.44 156 668.18 154 2655.78 180 0 72.00 180 0 81.00 160 0 72.00 172 8 73.24 157 3 69.09 157 23 58.89 917 43 30.29 117 63 19.09 69 91 -16.27 69 111 -26.67 41 32.23 119 61 21.83 102 58 15.74 102 78 5.34 154 6 56.18 154 26 55.78 118 42 31.26 118 62 20.86 160 0 72.00 167 13 58 39 137 23 49.69 137 43 39 29 145 15 57.45 145 35 47.08 112 48 25.44 112 58 15.04 16 56.48 38 46.00 E(ProDay45.07 E(Profit/Day 30,20 9.78 10.94 Prob(Loss) 0.07 ProbiLoss) 0.07 110 cum Fres Fres Free Bin Tops 40 20 O 20 0 0 : Histogram Data 0 O 0 2 o 20 . 1 2 5 30 2 2 30 30 30 Cum 0 0 2 2 6 14 30 20 1 1 3 25 c Cum Free D 0 1 1 2 1 5 3 9 4 18 9 30 12 30 D 3888 Free 0 0 2 2 2 7 5 15 24 28 4 30 2 4 8 16 0 47 4 50 51 53 54 55 Sheet1