

Question: Page 1 Question 12 (2 points) The graph below shows the cost curves for a random firm competing in a perfectly competitive market. Given the
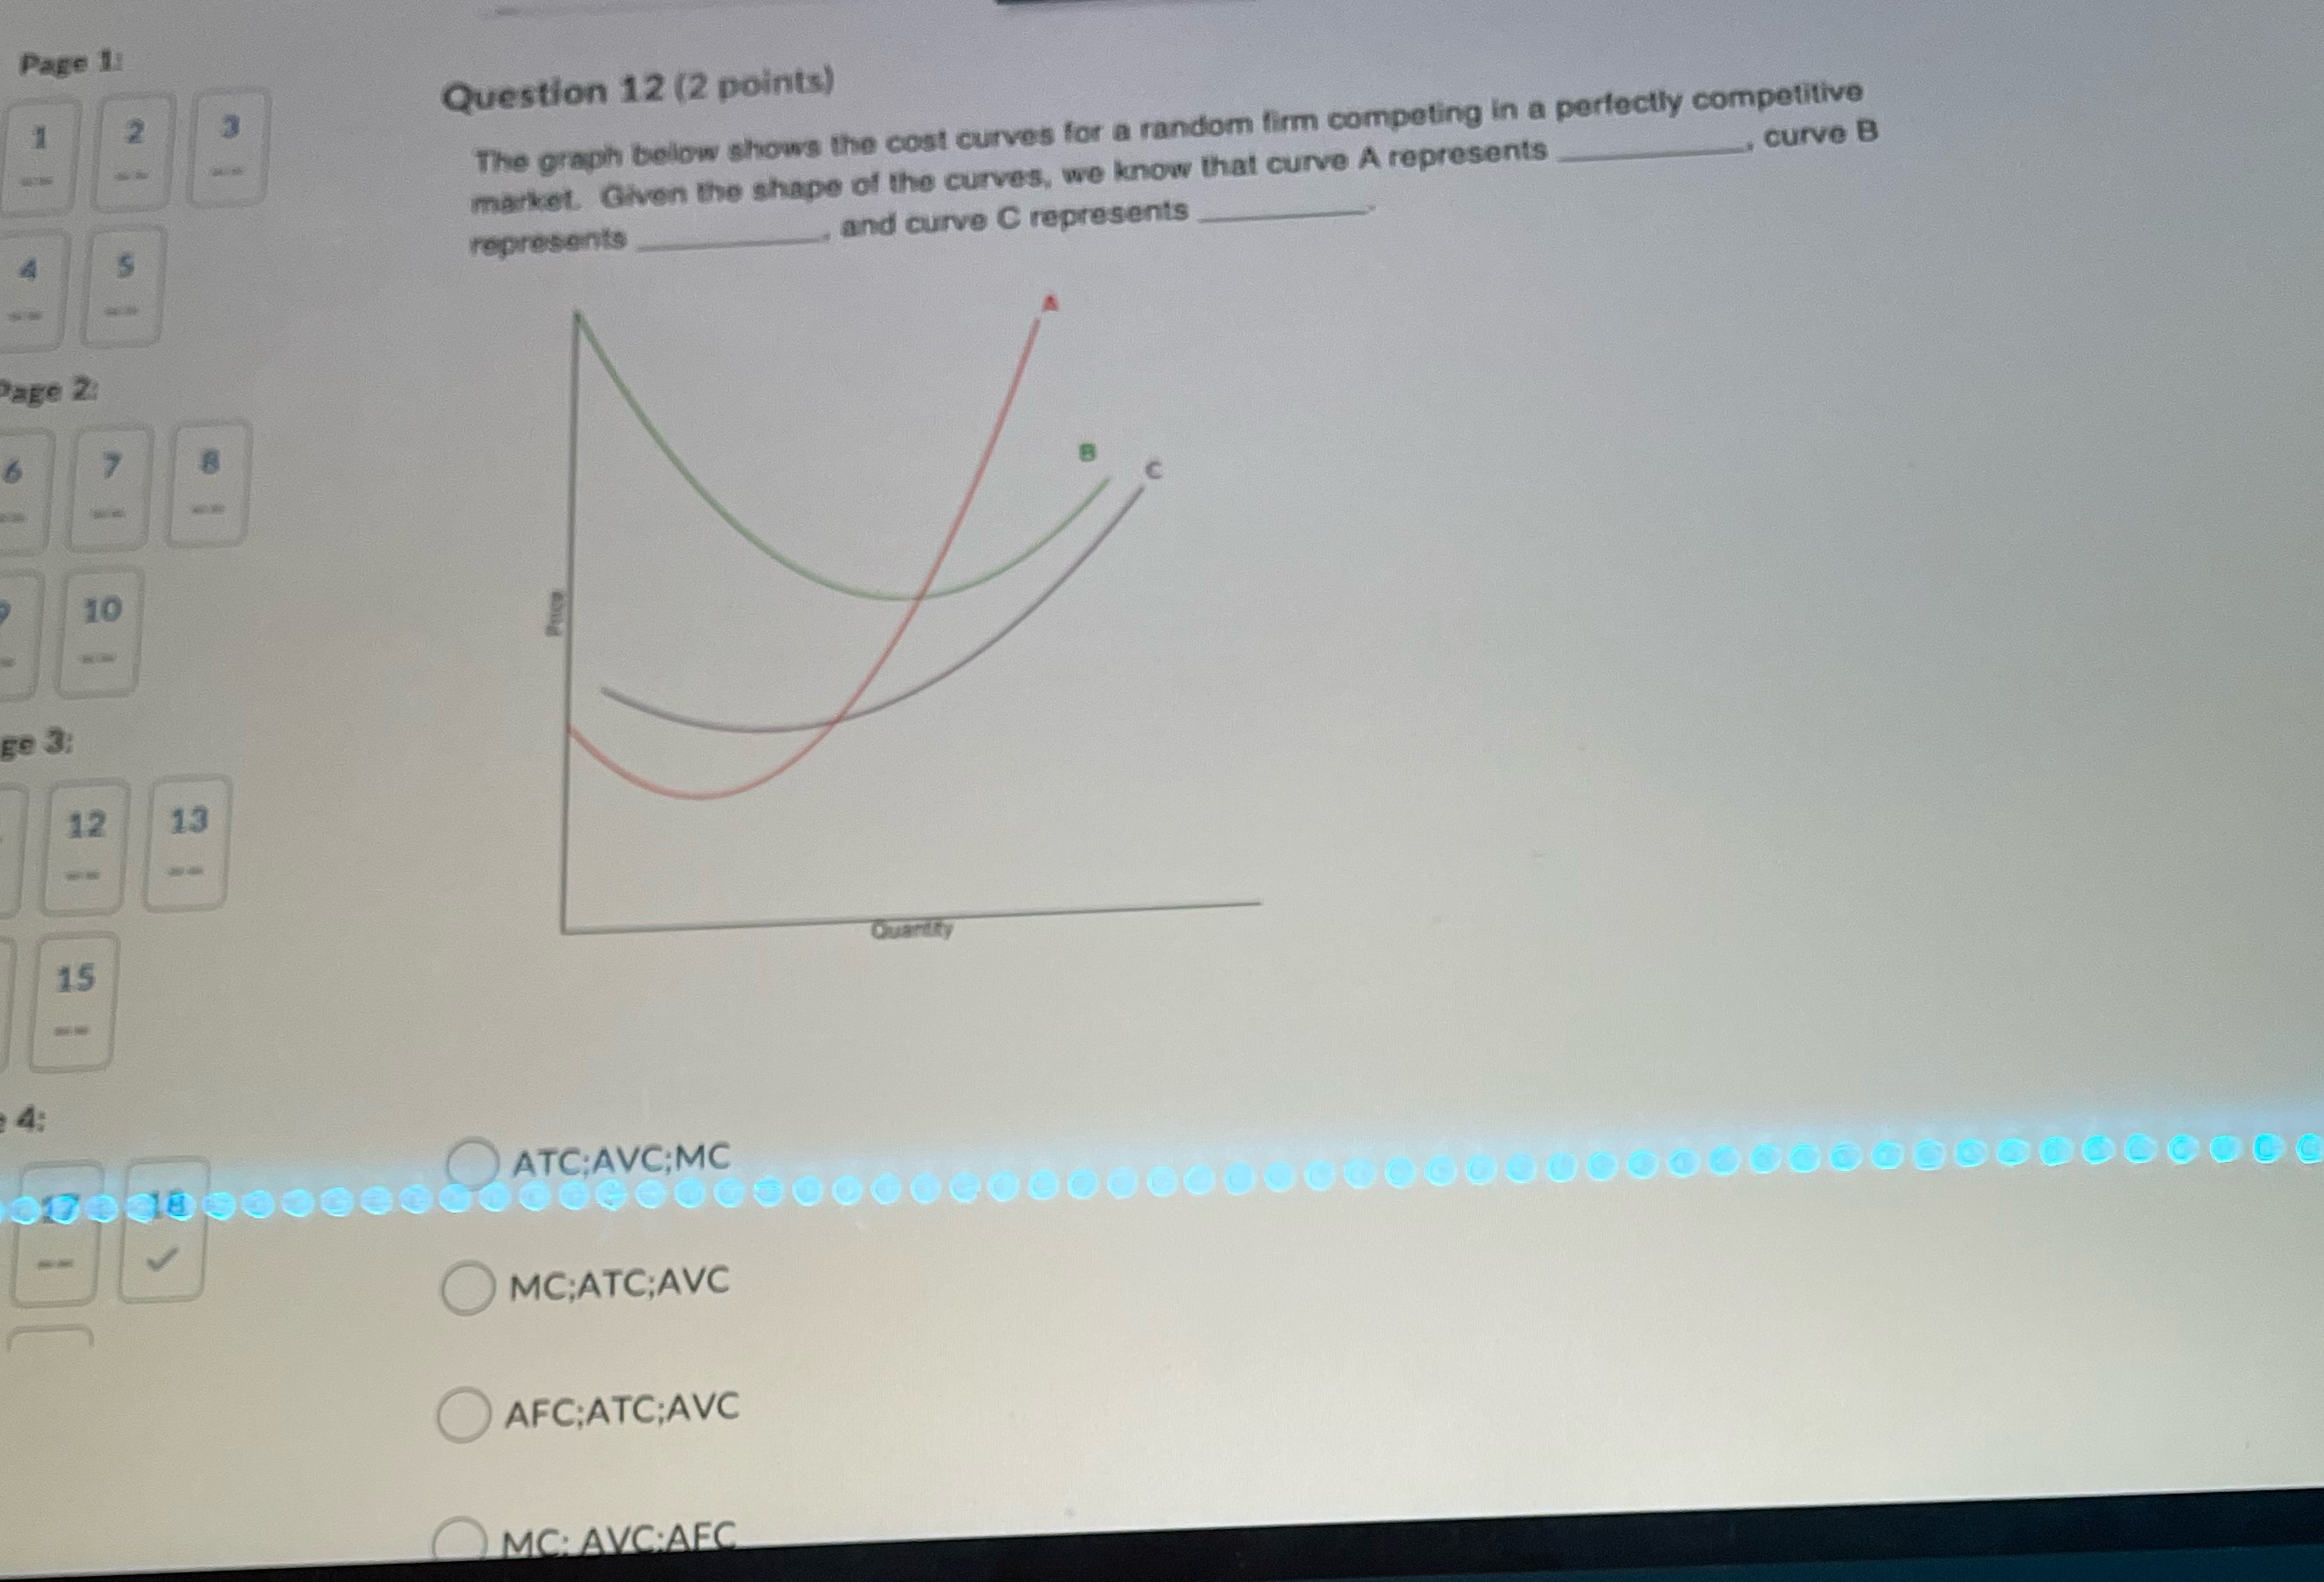
Page 1 Question 12 (2 points) The graph below shows the cost curves for a random firm competing in a perfectly competitive market. Given the shape of the curves, we know that curve A represents , curve B S represents and curve C represents Page 2 8 10 12 13 15 4: 309 30950645 ATC;AVC;MC OMC;ATC;AVC AFC;ATC;AVC MC: AVC;AFC
Step by Step Solution
There are 3 Steps involved in it
1 Expert Approved Answer
Step: 1 Unlock

Question Has Been Solved by an Expert!
Get step-by-step solutions from verified subject matter experts
Step: 2 Unlock
Step: 3 Unlock