

Question: page 2 of 4 Problem 2 (12 points, 2 points each sub-question) When a scatterplot of data points (It, y:), i = 1, ..., n,
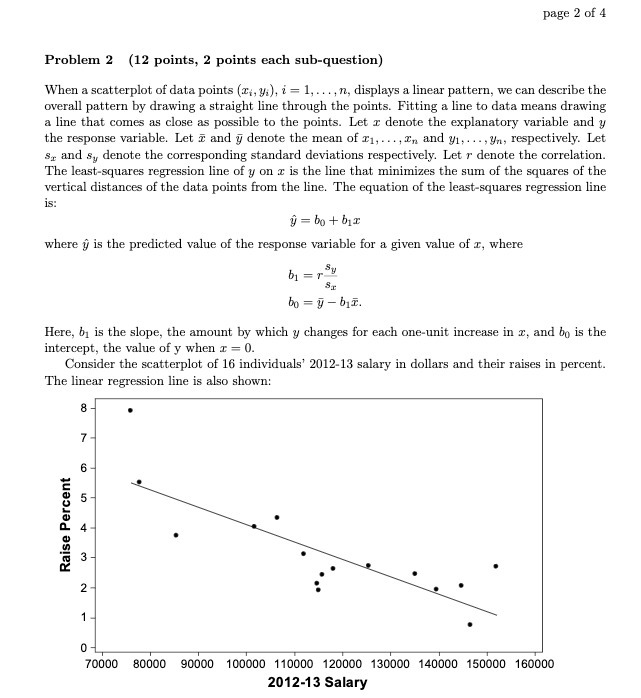
page 2 of 4 Problem 2 (12 points, 2 points each sub-question) When a scatterplot of data points (It, y:), i = 1, ..., n, displays a linear pattern, we can describe the overall pattern by drawing a straight line through the points. Fitting a line to data means drawing a line that comes as close as possible to the points. Let r denote the explanatory variable and y the response variable. Let a and y denote the mean of 1, ..., In and y1, ...,Un, respectively. Let sr and sy denote the corresponding standard deviations respectively. Let r denote the correlation. The least-squares regression line of y on a is the line that minimizes the sum of the squares of the vertical distances of the data points from the line. The equation of the least-squares regression line is: y = bot bir where y is the predicted value of the response variable for a given value of a, where b1 = r- bo = y - biz. Here, by is the slope, the amount by which y changes for each one-unit increase in r, and by is the intercept, the value of y when = = 0. Consider the scatterplot of 16 individuals' 2012-13 salary in dollars and their raises in percent. The linear regression line is also shown: 8 . 7 6 Raise Percent No 70000 80000 90000 100000 110000 120000 130000 140000 150000 160000 2012-13 Salary
Step by Step Solution
There are 3 Steps involved in it

Get step-by-step solutions from verified subject matter experts