

Question: Page of 8 13. Use the graph below to draw a low-pass filter with fc = 1000 Hz. Assume the frequencies in the passband are
Page
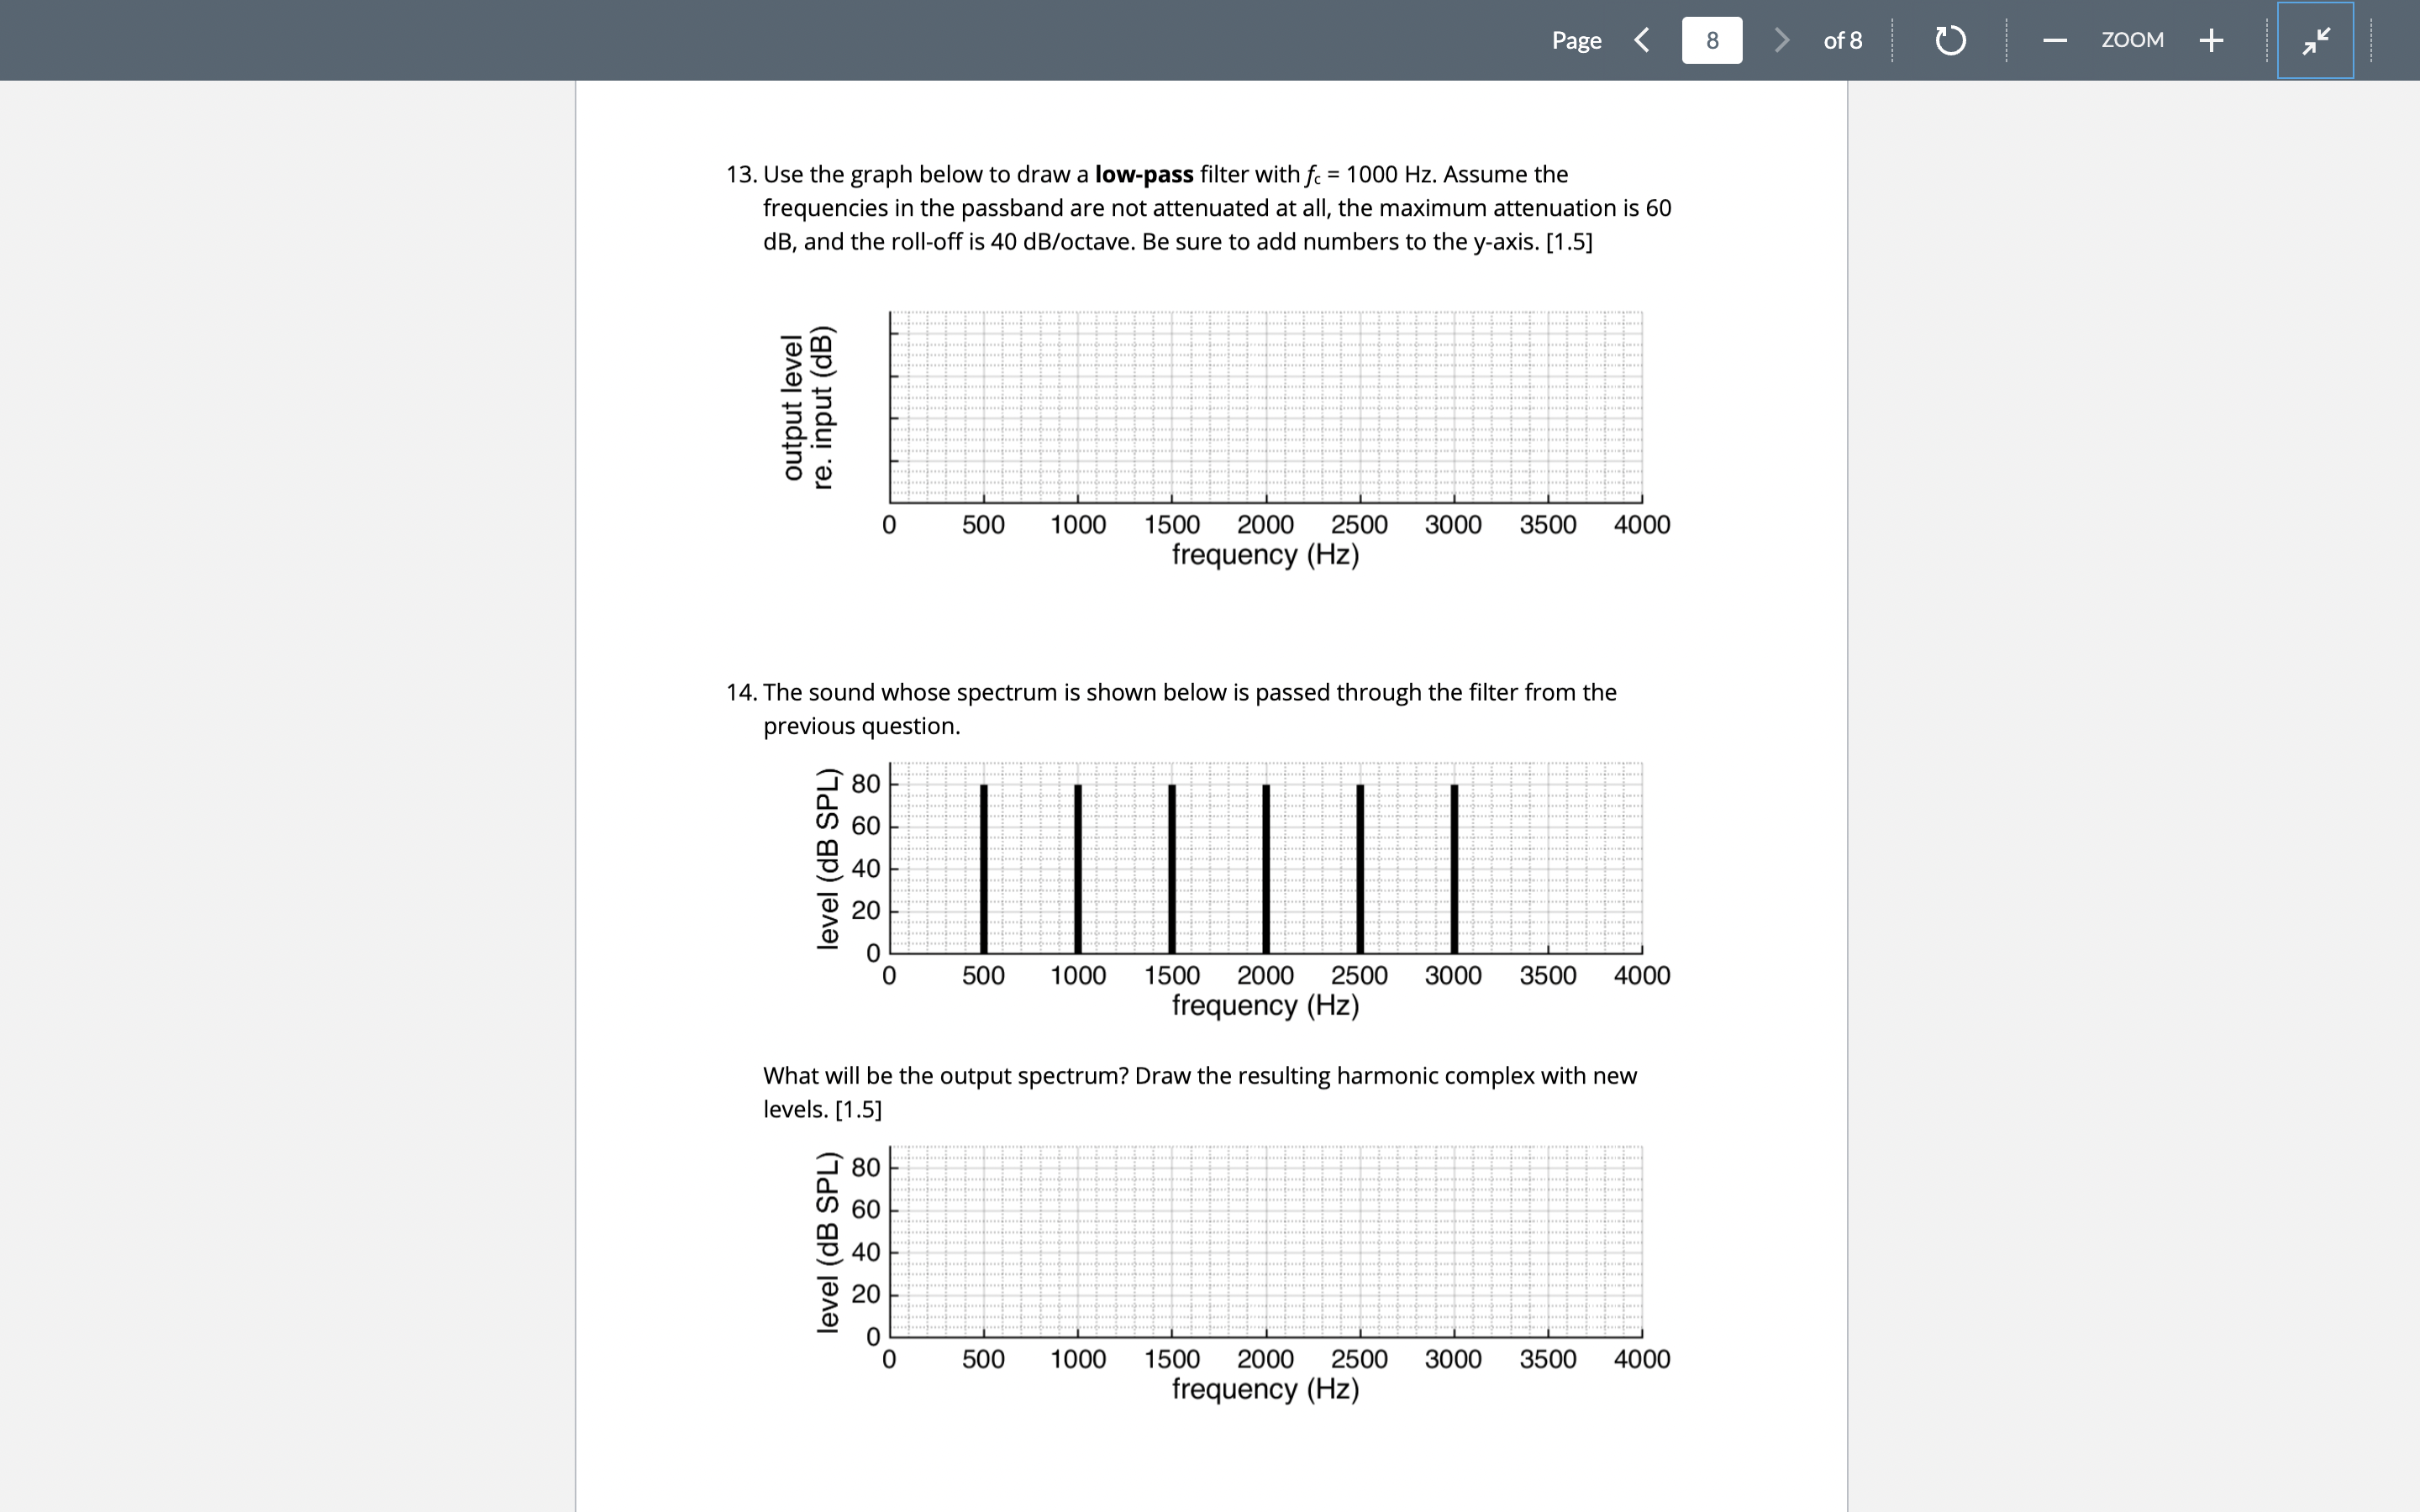
of 8 13. Use the graph below to draw a low-pass filter with fc = 1000 Hz. Assume the frequencies in the passband are not attenuated at all, the maximum attenuation is 60 dB, and the roll-off is 40 dB/octave. Be sure to add numbers to the y-axis. [1.5] 500 1000 1500 2000 2500 3000 3500 4000 frequency (Hz) 14. The sound whose spectrum is shown below is passed through the filter from the ZOOM previous question. 80 (D 60 -0 40 20 500 1000 1500 2000 2500 frequency (Hz) 3000 3500 4000 What will be the output spectrum? Draw the resulting harmonic complex with new levels. [1.5] 80 (D 60 -0 40 20 500 1000 1500 2000 2500 3000 3500 4000 frequency (Hz)
Step by Step Solution
There are 3 Steps involved in it

Get step-by-step solutions from verified subject matter experts