

Question: Pair 1 Paired Samples Statistics Mean N Std. Deviation Std. Error Mean T1 Scale of student's mathematics utility -.0107 3909 1.01462 .01623 T2 Scale
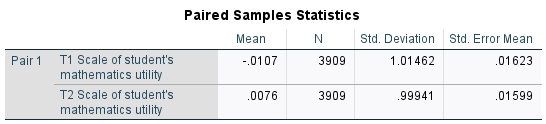
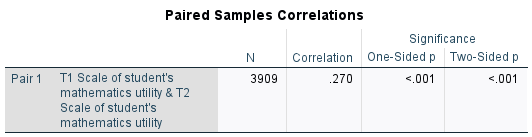
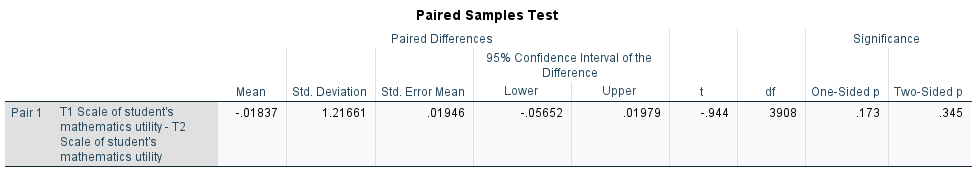
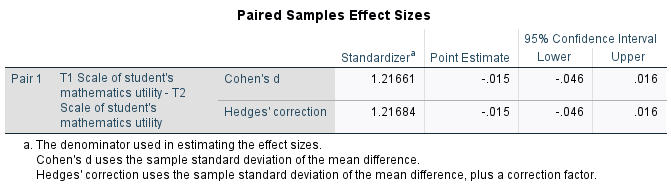
Pair 1 Paired Samples Statistics Mean N Std. Deviation Std. Error Mean T1 Scale of student's mathematics utility -.0107 3909 1.01462 .01623 T2 Scale of student's mathematics utility .0076 3909 .99941 .01599 Paired Samples Correlations N 3909 Significance Correlation One-Sided p Two-Sided p .270 Pair 1 T1 Scale of student's mathematics utility - T2 Scale of student's mathematics utility Paired Samples Test Paired Differences 95% Confidence Interval of the Mean -.01837 Std. Deviation 1.21661 Std. Error Mean .01946 Difference Lower Upper t df -.05652 .01979 -.944 3908 Significance One-Sided p Two-Sided p .173 .345 Paired Samples Effect Sizes 95% Confidence Interval Standardizer Point Estimate Lower Upper Pair 1 T1 Scale of student's mathematics utility - T2 Scale of student's Cohen's d 1.21661 -.015 -.046 .016 Hedges' correction 1.21684 -.015 -.046 .016 mathematics utility a. The denominator used in estimating the effect sizes. Cohen's d uses the sample standard deviation of the mean difference. Hedges' correction uses the sample standard deviation of the mean difference, plus a correction factor.
Step by Step Solution
There are 3 Steps involved in it

Get step-by-step solutions from verified subject matter experts