

Question: Paired Samples Statistics Pair 1 Group_Control_Mean Please record the number of symbols you reached in the allotted time below. - Number of symbols -
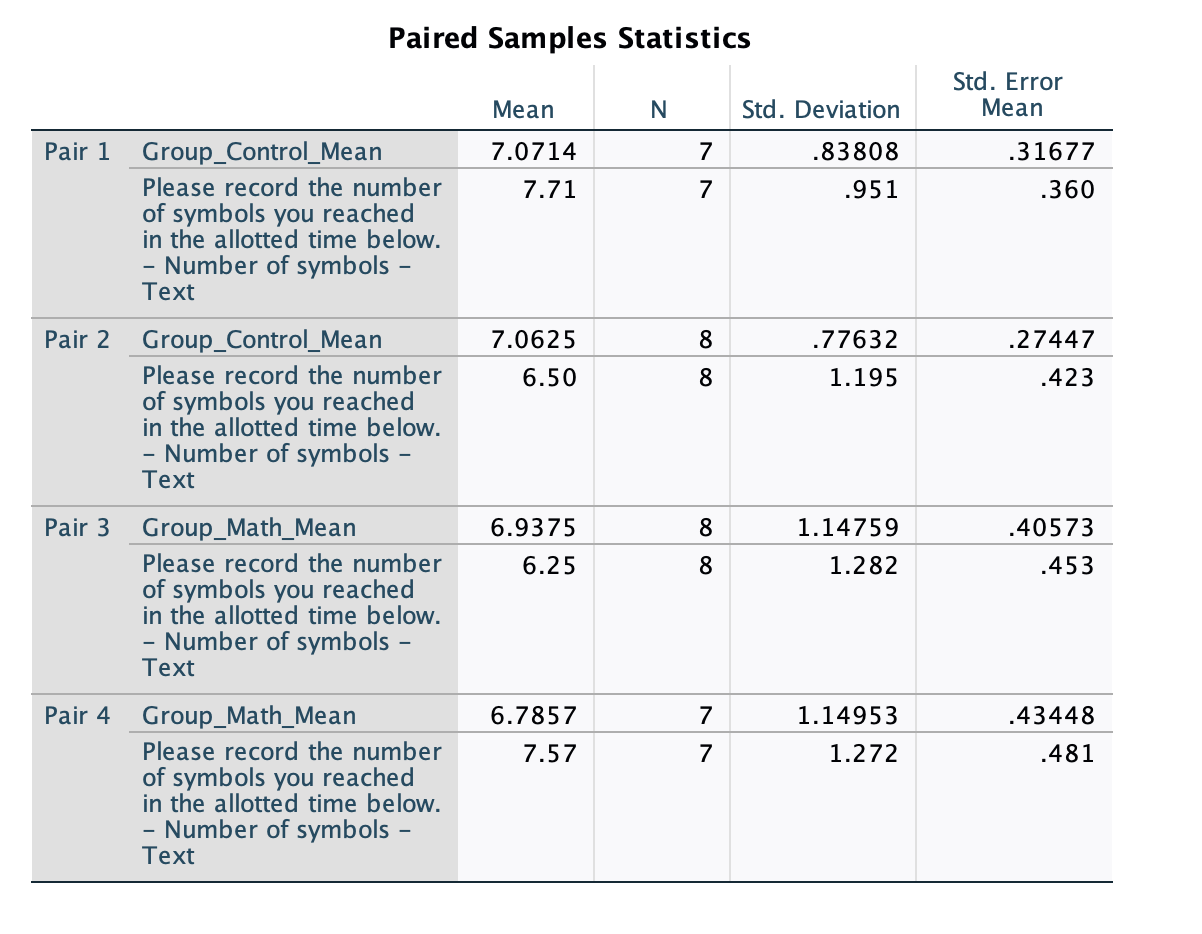
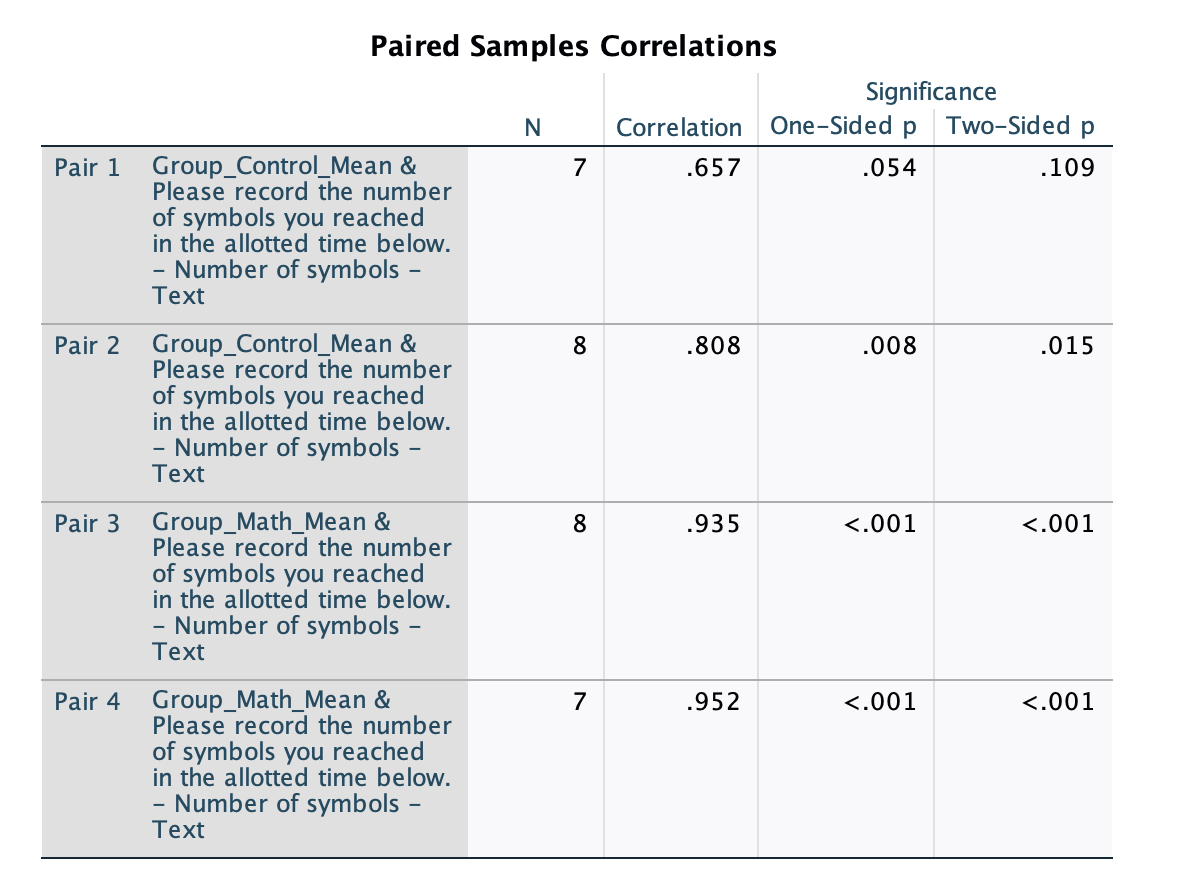
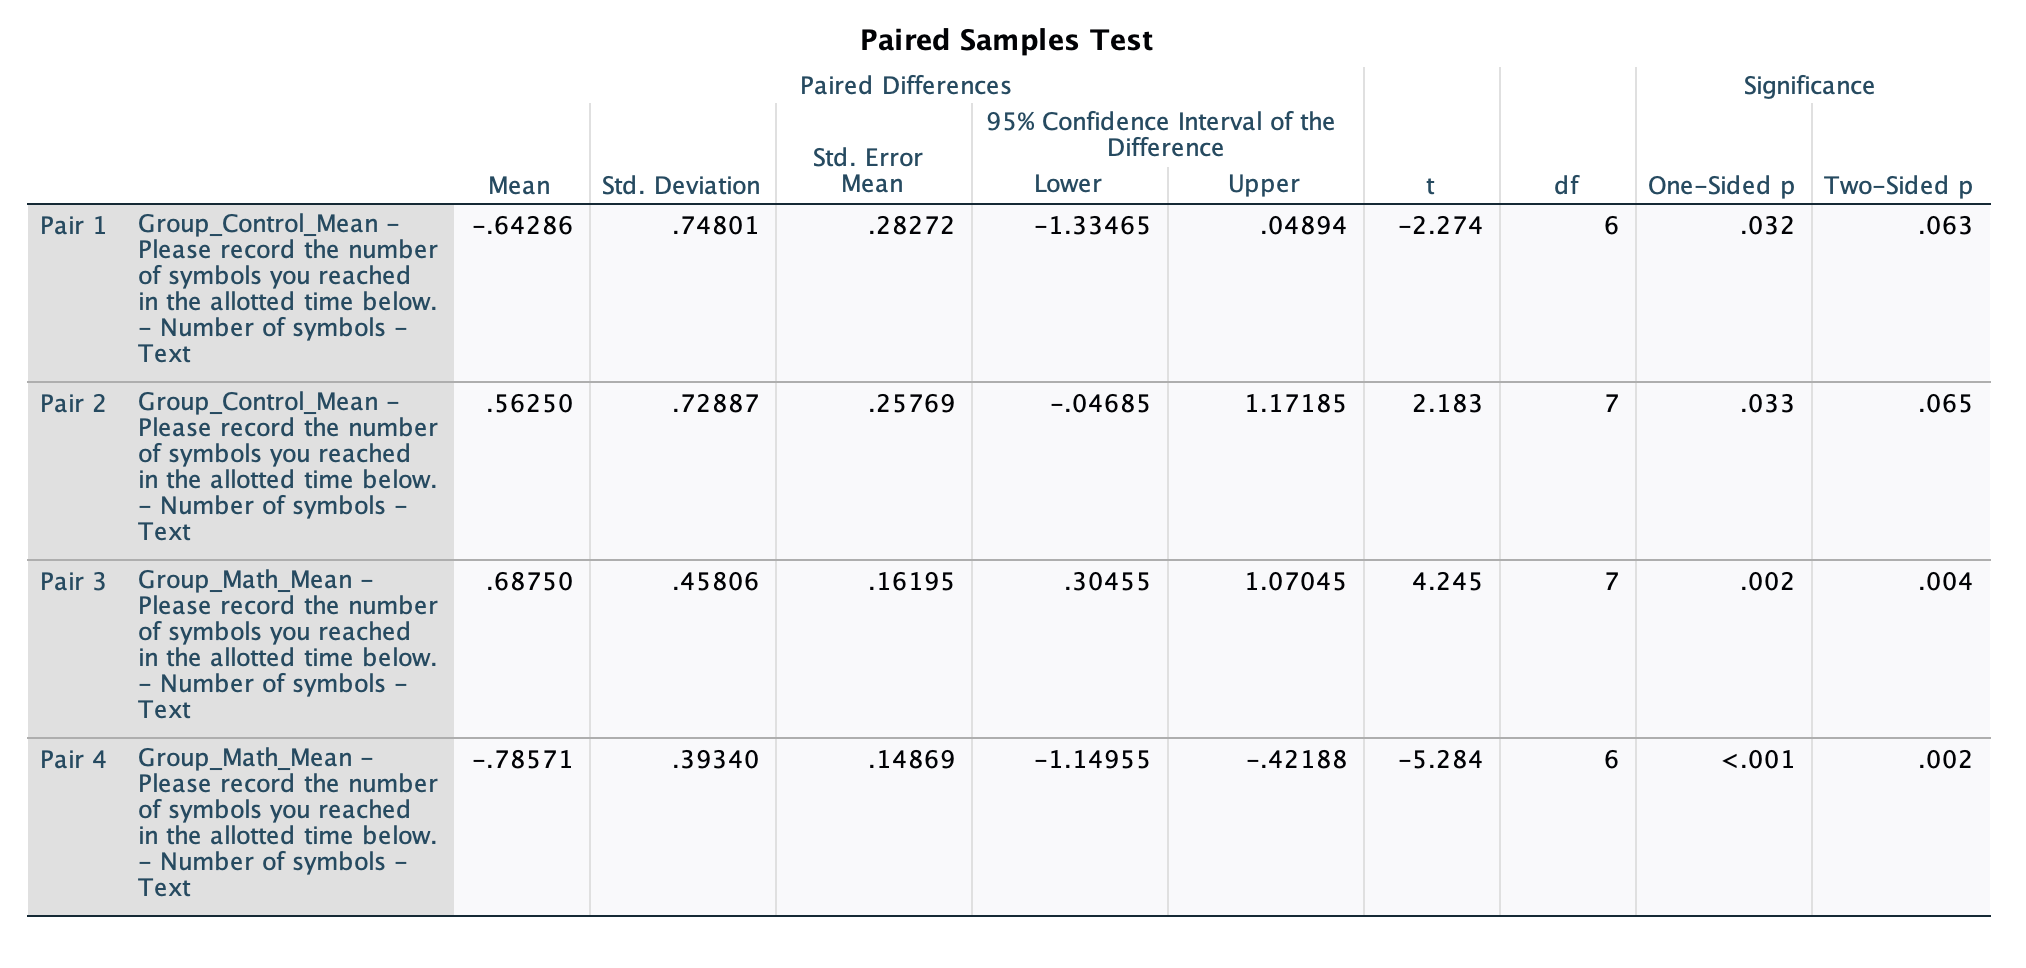
Paired Samples Statistics Pair 1 Group_Control_Mean Please record the number of symbols you reached in the allotted time below. - Number of symbols - Text Pair 2 Group_Control_Mean Please record the number of symbols you reached in the allotted time below. - Number of symbols - Text Pair 3 Group_Math_Mean Please record the number of symbols you reached in the allotted time below. Number of symbols - Text - Pair 4 Group Math_Mean Please record the number of symbols you reached in the allotted time below. - Number of symbols Text Std. Error Mean N Std. Deviation 7.0714 7 .83808 Mean .31677 7.71 7 .951 .360 7.0625 6.50 8 .77632 .27447 8 1.195 .423 6.9375 8 1.14759 .40573 6.25 8 1.282 .453 6.7857 7 1.14953 .43448 7.57 7 1.272 .481 Paired Samples Correlations Pair 1 Pair 2 Group_Control_Mean & Please record the number of symbols you reached in the allotted time below. - Number of symbols - Text Group_Control_Mean & Please record the number of symbols you reached in the allotted time below. - Number of symbols - Text Pair 3 Group Math_Mean & Pair 4 Please record the number of symbols you reached in the allotted time below. - Number of symbols - Text Group Math_Mean & Please record the number of symbols you reached in the allotted time below. - Number of symbols - Text Significance N Correlation One-Sided p Two-Sided p 7 .657 .054 .109 8 .808 .008 .015 8 .935 Pair 1 Pair 2 Pair 3 Pair 4 Group_Control_Mean - Please record the number of symbols you reached in the allotted time below. - Number of symbols - Text Group_Control_Mean - Please record the number of symbols you reached in the allotted time below. - Number of symbols - Text Group_Math_Mean - Please record the number of symbols you reached in the allotted time below. - Number of symbols - Text Group Math_Mean - Please record the number of symbols you reached in the allotted time below. - Number of symbols - Text Paired Samples Test Paired Differences 95% Confidence Interval of the Difference Std. Error Mean -.64286 Std. Deviation Mean Lower Upper t df .74801 .28272 -1.33465 .04894 -2.274 6 Significance One-Sided p Two-Sided p .032 .063 .56250 .72887 .25769 -.04685 1.17185 2.183 7 .033 .065 .68750 .45806 .16195 .30455 1.07045 4.245 7 .002 .004 -.78571 .39340 .14869 -1.14955 -.42188 -5.284 6
Step by Step Solution
There are 3 Steps involved in it

Get step-by-step solutions from verified subject matter experts