

Question: Pane Symbols Question: 4 Asset Allocation with Two Risky Assets. The following spreadsheet measures the average tendency of asset returns to vary in tandem, i.e.,
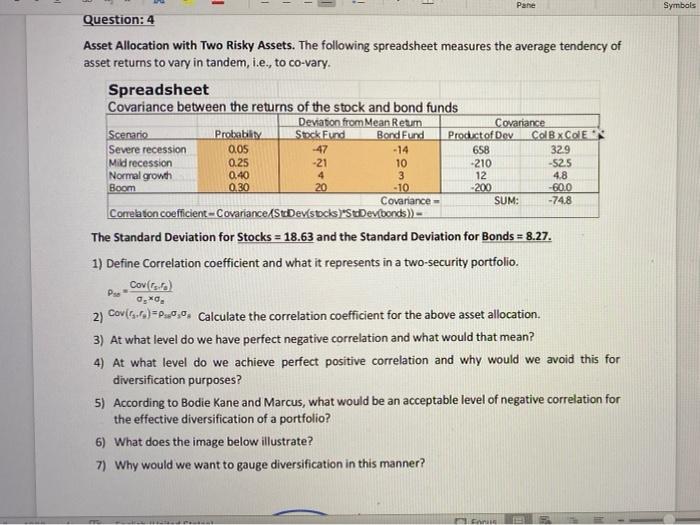
Pane Symbols Question: 4 Asset Allocation with Two Risky Assets. The following spreadsheet measures the average tendency of asset returns to vary in tandem, i.e., to co-vary. Spreadsheet Covariance between the returns of the stock and bond funds Deviation from Mean Retum Covariance Scenario Probably Stock Fund Bond Fund Product of Dev Colex Cole Severe recession 0.05 -14 658 329 Mild recession 0.25 -21 10 -210 -52.5 Normal growth 0.40 4 3 12 4.8 Boom 0.30 20 -10 -200 - 60.0 Covariance SUM: -748 Correlaton coefficient-CovarianceStoevstocks)"StoDevibonds) - The Standard Deviation for Stocks = 18.63 and the Standard Deviation for Bonds = 8.27. 1) Define Correlation coefficient and what it represents in a two-security portfolio. Covisto) Ps 0,0. 2) Cov(GC)=2,0,0. Calculate the correlation coefficient for the above asset allocation. 3) At what level do we have perfect negative correlation and what would that mean? 4) At what level do we achieve perfect positive correlation and why would we avoid this for diversification purposes? 5) According to Bodie Kane and Marcus, what would be an acceptable level of negative correlation for the effective diversification of a portfolio? 6) What does the image below illustrate? 7) Why would we want to gauge diversification in this manner
Step by Step Solution
There are 3 Steps involved in it

Get step-by-step solutions from verified subject matter experts