

Question: PAPER #1 Economic Principle : Scarcity -- How it forces us to make choices which result in opportunity cost. Page 1 In your own words
PAPER #1
Economic Principle: Scarcity -- How it forces us to make choices which result in opportunity cost.
Page 1 | In your own words (don't quote the text), explain as completely as you can what an economist means by scarcity and opportunity cost. How do the 2 concepts relate? Link them. What do resources have to do with this? Are scarcity and shortage the same? Explain. What do economists mean when they cite opportunity cost and what's the connection between opportunity cost and scarcity? Why does economic theory argue that we can't "have it all"? Organization and a logical development is important. You will have to take these questions and those under the paper tips and ORGANIZE them into a LOGICAL sequence.... simply answering the prompts as they appear therefore is NOT a logical sequence. 1-1.5pages in length |
Page 2 | Select 2 goods or services YOU ACTUALLY produce. (IT MUST PERTAIN TO PRODUCTION, Not Consumption ) Money is not an issue not par of the paper. Assume youhave theresourcesfor a short period of time.Explain how scarcity forces you to make choices. What is the opportunity cost or relative price ( you solve this using the worksheet) of producing each good. Keep in mind the economic definition of opportunity cost and answer in that context.These need to be expressed in relative prices. Also this section needs to include the resources you utilize in the production of each good,service or resource chosen and to categorize them as well. 1-1.5 pages in length |
Page 3 | Graph. Draw a production possibilities curve (PPC) to graphically show the personal trade-offs you described on page 2. Title must include: your name, the 2 products, the time period of production in a SINGLE phrase. All axes must be labeled and indicate proper units of measure. A unit of measure is how you define your product... think of packaging at the grocery... Tide lliquid laundry detergent is measured in ounces. Remember that you're graphing 2 "GOODS" -- in other words, you should have some desirable output on each axis, NOT the scarce resources/input (I.e., your labor). The graphs you attach to your papers can be computer-generated or hand-drawn. If you hand-draw your graph, it must be drawn on graph paper. In either case, your graph should be neat, correctly composed, and completely labeled. Go to the "How to..." folder to see how to draw graphs in Word. Or take a picture and send as a JPEG file. Better yet use the Snipping tool to attach it to your WORD document. |
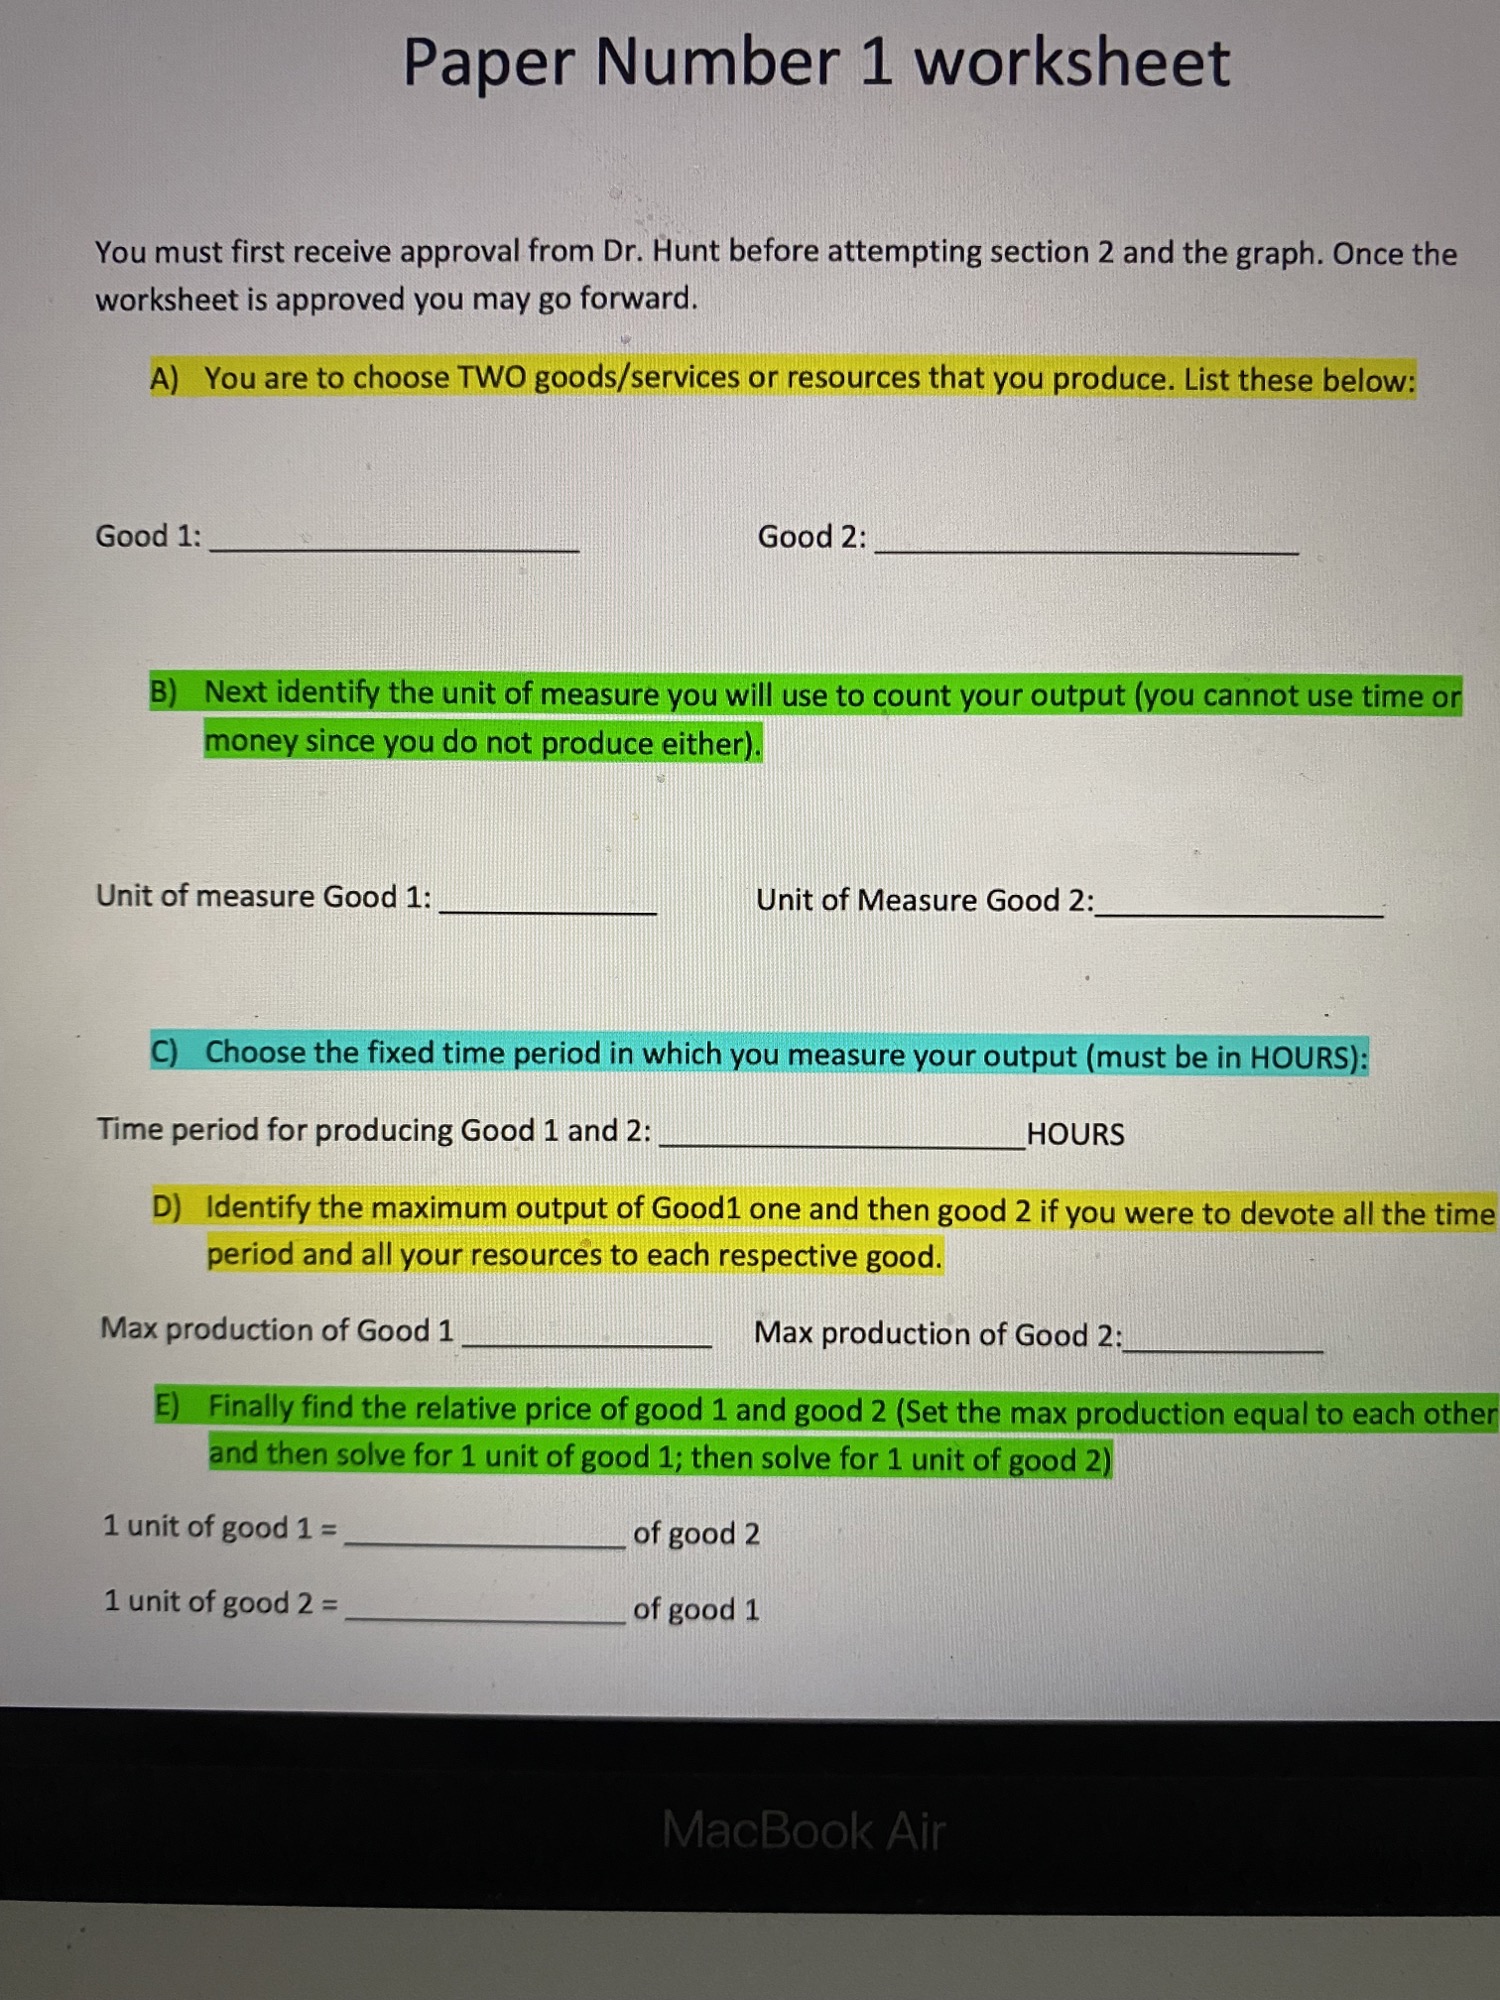
Paper Number 1 worksheet You must first receive approval from Dr. Hunt before attempting section 2 and the graph. Once the worksheet is approved you may go forward. A) You are to choose TWO goods/services or resources that you produce. List these below: Good 1: Good 2: B) Next identify the unit of measure you will use to count your output (you cannot use time or money since you do not produce either). Unit of measure Good 1: Unit of Measure Good 2: C) Choose the fixed time period in which you measure your output (must be in HOURS): Time period for producing Good 1 and 2: HOURS D) Identify the maximum output of Good1 one and then good 2 if you were to devote all the time period and all your resources to each respective good. Max production of Good 1 Max production of Good 2: E) Finally find the relative price of good 1 and good 2 (Set the max production equal to each other and then solve for 1 unit of good 1; then solve for 1 unit of good 2) 1 unit of good 1 = of good 2 1 unit of good 2 = of good 1 MacBook Air
Step by Step Solution
There are 3 Steps involved in it

Get step-by-step solutions from verified subject matter experts