

Question: % % Parameters N = 5 ; % Number of users L = 5 ; % Number of subcarriers B = 3 ; % Near
Parameters
N ; Number of users
L ; Number of subcarriers
B ; Near users
phi ; Far users
alpha randi L N; Power allocation for each user and subcarrier
PT ; Transmit power
n ; User of interest
hn randnL; Channel coefficients for each subcarrier
sigma; Noise variance
S randi L N; Transmitted symbols for each user and subcarrier
g onesN; Scaling factor
wn sqrtsigma randnL; AWGN noise
sik randi N L; Modulated symbols for each user and subcarrier
Preallocate for received signals
ynscalarCNOMA zerosL;
ynscalarIMNOMACR zerosL;
Loop through subcarriers: CNOMA Received Signal Calculation
for k :L
Intended signal for the nth user on the kth subcarrier
intendedsignal hnk sqrtalphak n PT sikn k;
Interference signals from other users
interferencesignal ;
for i :N
if i ~ n
interferencesignal interferencesignal
hnk sqrtalphak i PT siki k;
end
end
Received signal with interference and noise CNOMA
ynscalarCNOMAk intendedsignal interferencesignal wnk;
end
IMNOMACR Received Signal Calculation
for k :L
Calculating xk as per the equation
xk sumsqrtalphak:B PT sik:B k
sumsqrtalphak B:Nphi PT sikB:Nphi, k;
Calculating phik as per the equation
phik sumsqrtalphak:B PT sik:B k
sumsqrtalphak B:Nphi PT sikB:Nphi, k
expj pi sumsqrtalphak Nphi:N PT sikNphi:N k;
Received signal with noise IMNOMACR
ynscalarIMNOMACRk hnk xk wnk;
end
Maximum Likelihood ML Detection for IMNOMACR
possiblesymbols ; BPSK Symbols
detectedsymbolsmlIMNOMACR zerosL;
for k :L
mindistance Inf; Initialize with a high value
bestsymbol ;
Search over all possible transmitted symbols
for xcandidate possiblesymbols
Calculate Euclidean distance for each candidate
distance absynscalarIMNOMACRk hnk xcandidate;
Find the symbol with minimum distance
if distance mindistance
mindistance distance;
bestsymbol xcandidate;
end
end
Assign detected symbol
detectedsymbolsmlIMNOMACRk bestsymbol;
end
Display the detected symbols for IMNOMACR
dispML Detected Symbols for IMNOMACR:;
dispdetectedsymbolsmlIMNOMACR;
SNR vs BER Calculation
SNRdB ::; SNR values in dB
SNRlinear SNRdB ; Convert SNR to linear scale
Calculate BER trends replace with real logic if needed
BERCNOMA SNRlinear; CNOMA BER trend
BERIMNOMACR SNRlinear; IMNOMACR BER trend
Plotting the BER Comparison Graph
figure;
semilogySNRdB BERCNOMA, g 'LineWidth', 'DisplayName', CNOMA ML All'; hold on;
semilogySNRdB BERCNOMA ks 'LineWidth', 'DisplayName', CNOMA ML Near';
semilogySNRdB BERCNOMA bo 'LineWidth', 'DisplayName', CNOMA ML Far';
semilogySNRdB BERIMNOMACRr 'LineWidth', 'DisplayName', IMNOMACR ML All';
semilogySNRdB BERIMNOMACR md 'LineWidth', 'DisplayName', IMNOMACR ML Near';
semilogySNRdB BERIMNOMACR cp 'LineWidth', 'DisplayName', IMNOMACR ML Far';
hold off;
Set axis labels and title
xlabelSNR dB;
ylabelBER;
titleBER Comparison between CNOMA and IMNOMACR;
legendLocation 'southwest';
grid on;
In this i have used ML detector Now I want an matlab code using log likelihood detector and maximum ratio combining Detector.output should be the fig you can use any AI tools but i want same graph as output.but graphs are different i will report.You can use any AI tools but graph is important
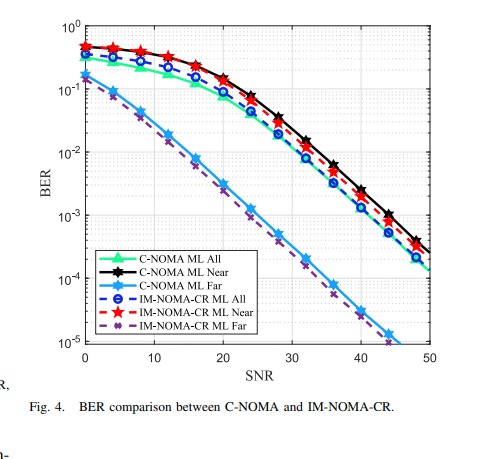
Fig. BER comparison between CNOMA and IMNOMACR
Step by Step Solution
There are 3 Steps involved in it
1 Expert Approved Answer
Step: 1 Unlock

Question Has Been Solved by an Expert!
Get step-by-step solutions from verified subject matter experts
Step: 2 Unlock
Step: 3 Unlock