

Question: Paraphrasing Tool | QuillBot Al X Assignments X Take a Test - hanmeng li X Search results for: 'zelda' Homework Help - Q&A from Or
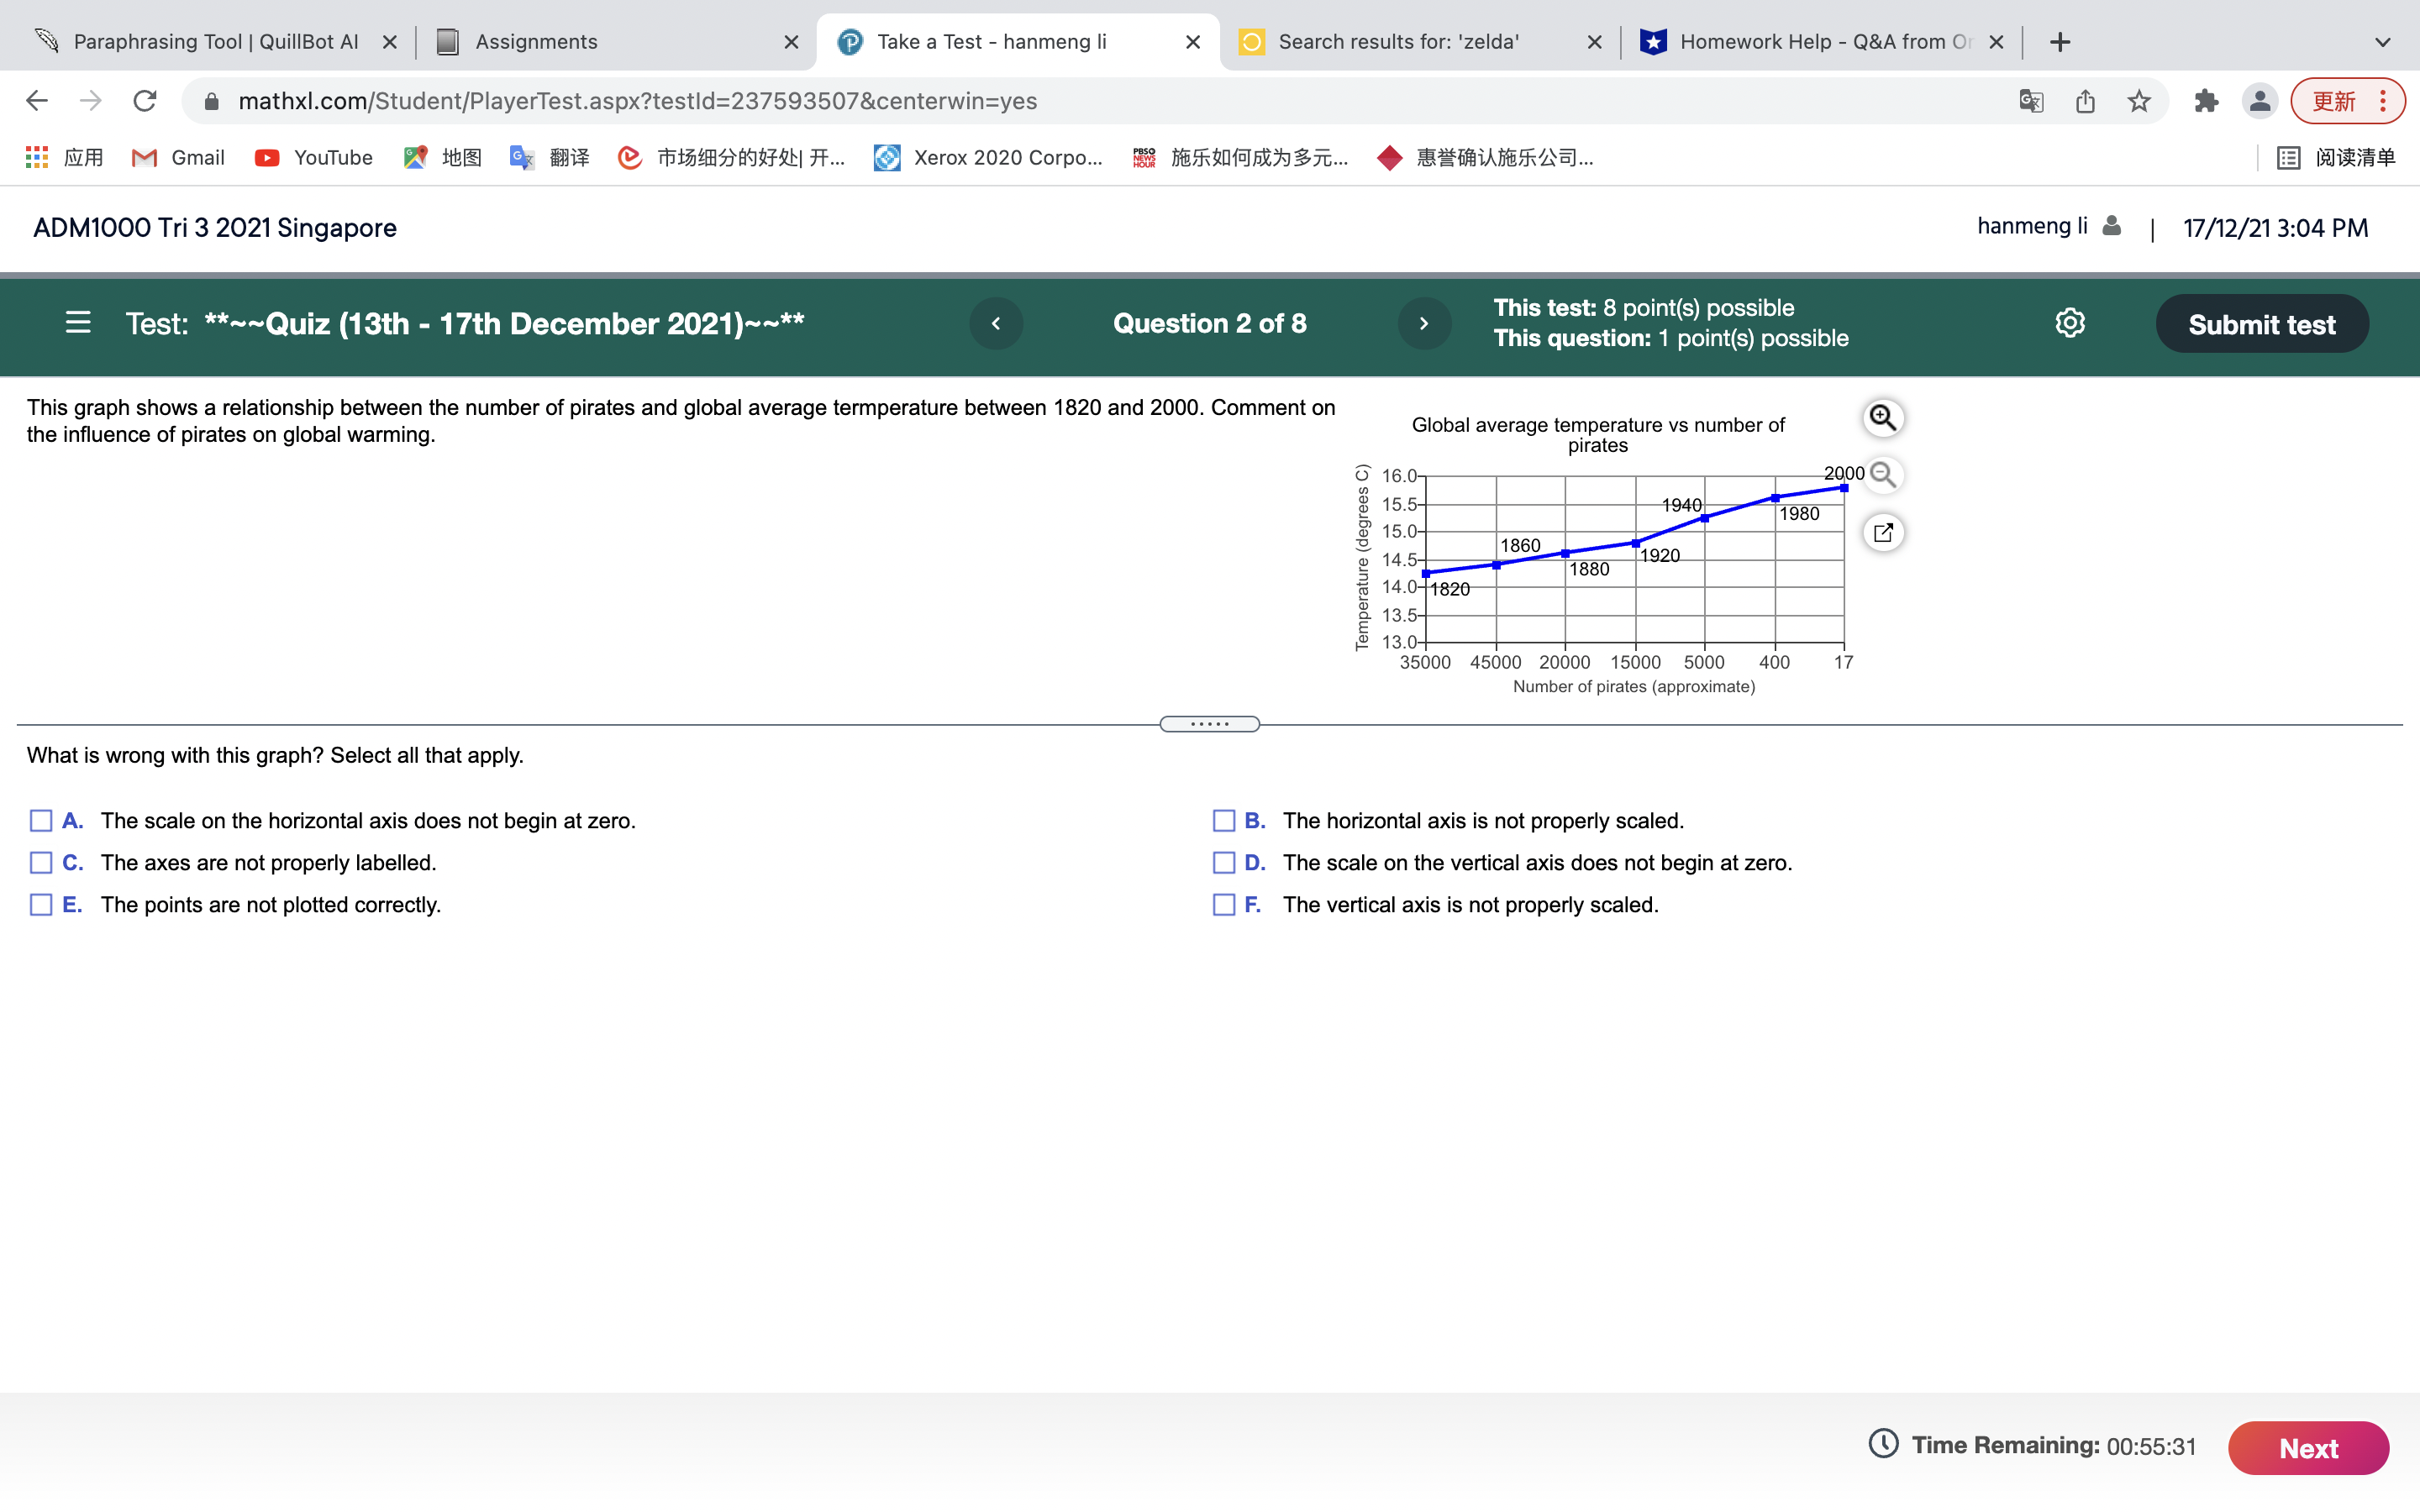
Paraphrasing Tool | QuillBot Al X Assignments X Take a Test - hanmeng li X Search results for: 'zelda' Homework Help - Q&A from Or X + C mathxl.com/Student/PlayerTest.aspx?testld=237593507¢erwin=yes : /A M Gmail YouTube tta it @ 1345)837AFF. Xerox 2020 Corpo... ADM1000 Tri 3 2021 Singapore hanmeng li & | 17/12/21 3:04 PM = Test: **~~Quiz (13th - 17th December 2021)~~** Question 2 of 8 This test: 8 point(s) possible This question: 1 point(s) possible Submit test This graph shows a relationship between the number of pirates and global average termperature between 1820 and 2000. Comment on the influence of pirates on global warming. Global average temperature vs number of pirates 16.0- 2000 grees 15.5- 940 1980 15.0 1860 14.5 1880 1920 14.0- 1820 mperat 13.5- 35000 45000 20000 15000 5000 400 17 Number of pirates (approximate) What is wrong with this graph? Select all that apply. A. The scale on the horizontal axis does not begin at zero. B. The horizontal axis is not properly scaled. C. The axes are not properly labelled. D. The scale on the vertical axis does not begin at zero. E. The points are not plotted correctly. OF. The vertical axis is not properly scaled. Time Remaining: 00:55:31 Next
Step by Step Solution
There are 3 Steps involved in it

Get step-by-step solutions from verified subject matter experts