

Question: Part 1 1) I need to choose one appropriate statistical test such as (Independent Sample Test or One way ANOVA etc anything works) that is
Part 1
1) I need to choose one appropriate statistical test such as (Independent Sample Test or One way ANOVA etc anything works) that is based on the level of measurement of DV(BMI) and IV (Group 1,2) but I don't know what statistical test I should choose. So, I've chose to create descriptive statistics and T-Test (One- Sample Statistics, One Sample Test, One-Sample Effect Sizes). I don't know if I'm right in choosing the graph.
(2)If the graph is okay, Then, there needs to be a brief explanation of reason why the specific test was chosen.
(3) State the null (H0) and alternative (H) hypotheses of the test,
4) Show all the relevant SPSS output tables.
Part 2: I need to answer questions based on the tables and graphs below.
(1) how many total valid observations are in the sample?
(2) what is the average mean of each group, number of people in each group,
(3) what is the test statistics value?, what is the p-value? etc. Explaining the statistical results.
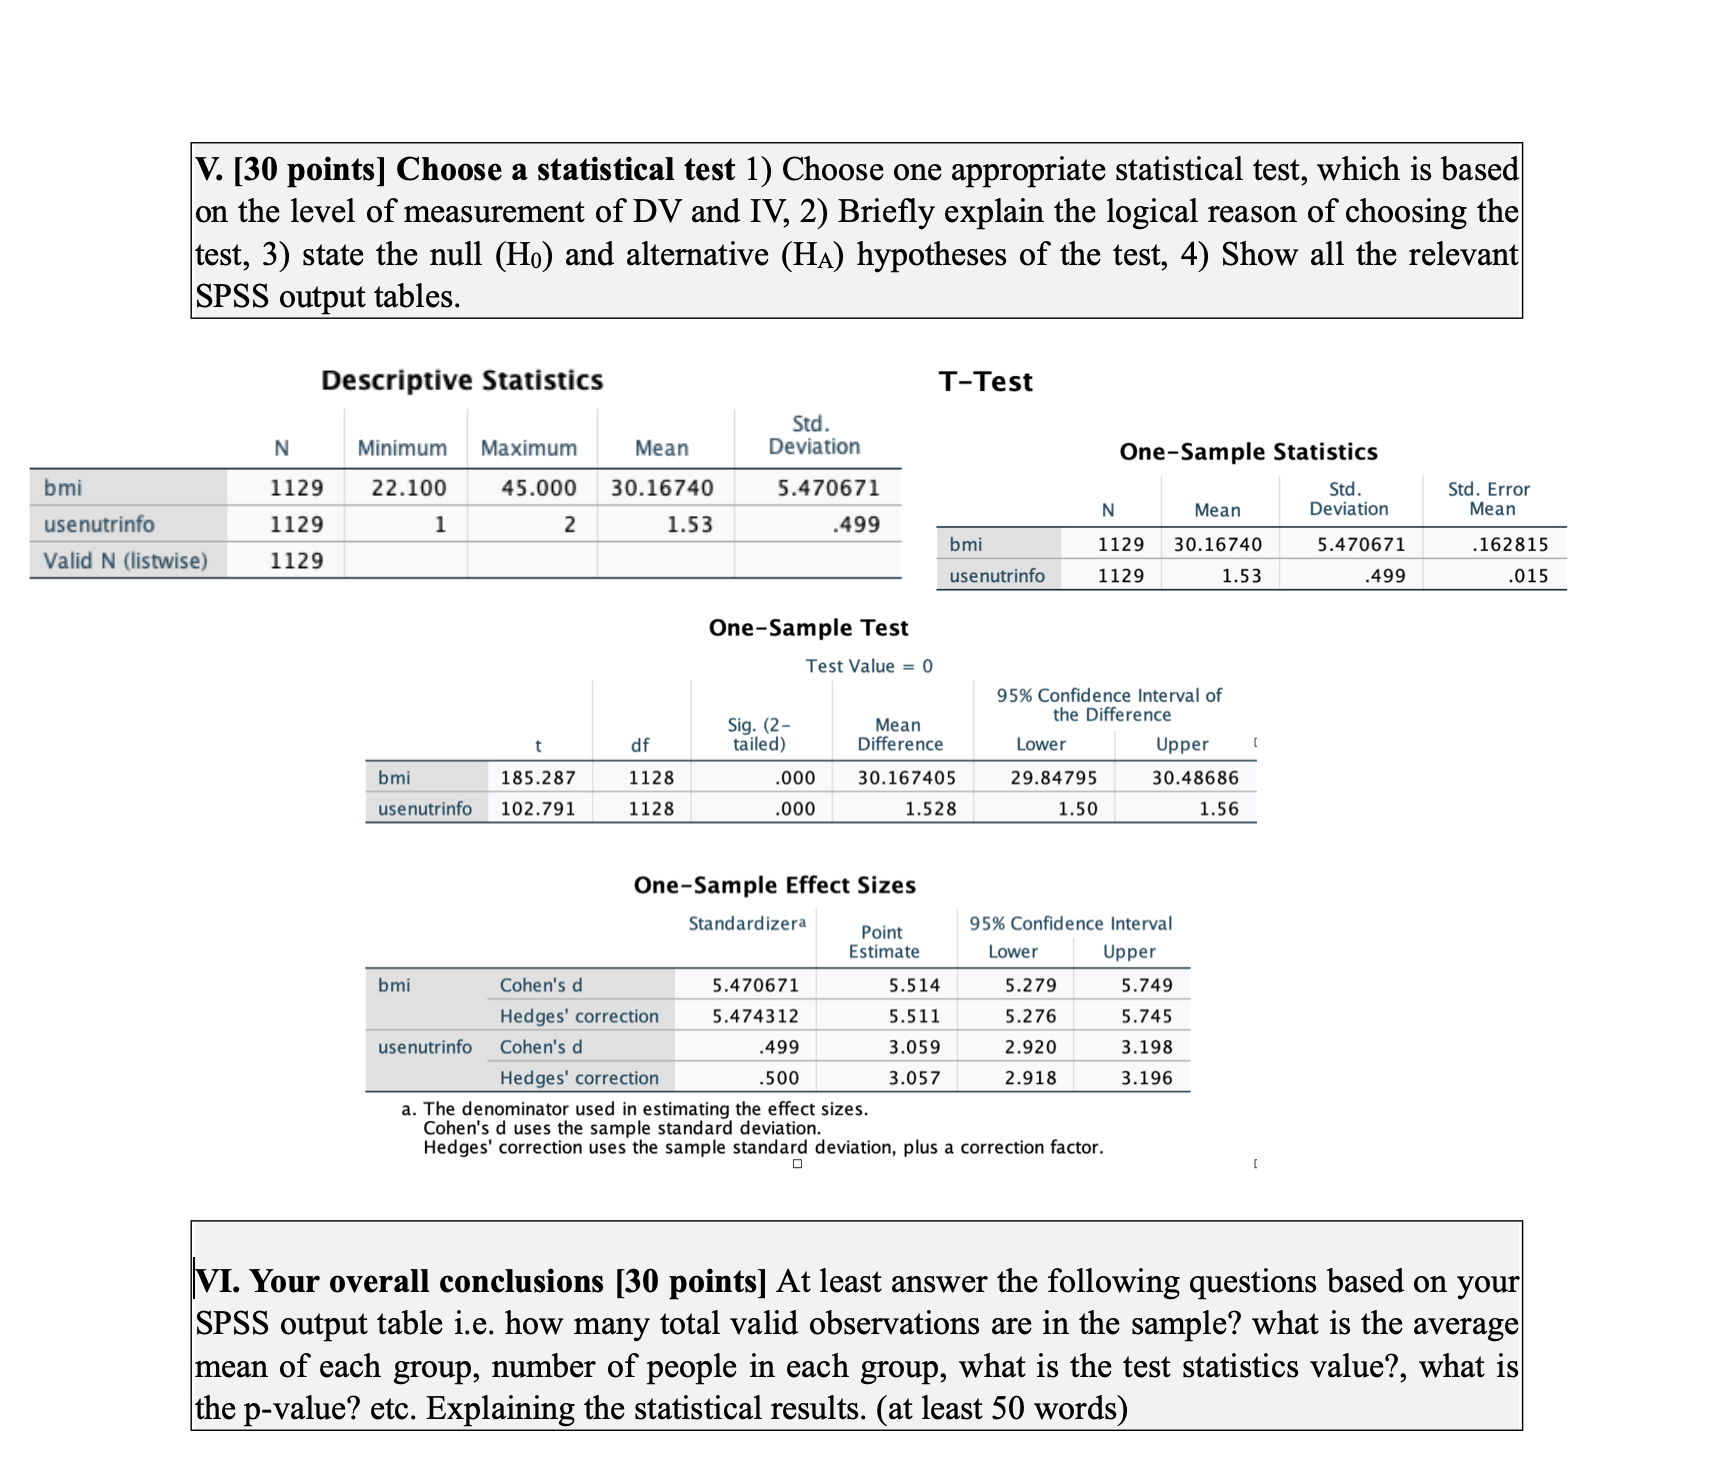
V. [30 points] Choose a statistical test 1) Choose one appropriate statistical test, which is based on the level of measurement of DV and IV, 2) Briefly explain the logical reason of choosing the test, 3) state the null (Ho) and alternative (HA) hypotheses of the test, 4) Show all the relevant SPSS output tables. Descriptive Statistics T-Test Std. N Minimum Maximum Mean Deviation One-Sample Statistics bmi 1129 22.100 45.000 30.16740 5.470671 Std. Std. Error N Mean Deviation Mean usenutrinfo 1129 1.53 499 bmi 1129 30.16740 5.470671 162815 Valid N (listwise) 1 129 usenutrinfo 1129 1.53 .499 015 One-Sample Test Test Value = 0 95% Confidence Interval of sig. (2- Mean the Difference df tailed) Difference Lower Upper bmi 185.287 1128 000 30.167405 29.84795 30.48686 usenutrinfo 102.791 1128 000 1.528 1.50 1.56 One-Sample Effect Sizes Standardizera Point 95% Confidence Interval Estimate Lower Upper bmi Cohen's d 5.470671 5.514 5.279 5.749 Hedges' correction 5.474312 5.511 5.276 5.745 usenutrinfo Cohen's d .499 3.059 2.920 3.198 Hedges' correction .500 3.057 2.918 3.196 a. The denominator used in estimating the effect sizes. Cohen's d uses the sample standard deviation. Hedges' correction uses the sample standard deviation, plus a correction factor. VI. Your overall conclusions [30 points] At least answer the following questions based on your SPSS output table i.e. how many total valid observations are in the sample? what is the average mean of each group, number of people in each group, what is the test statistics value?, what is the p-value? etc. Explaining the statistical results. (at least 50 words)
Step by Step Solution
There are 3 Steps involved in it

Get step-by-step solutions from verified subject matter experts