

Question: PART 1 1. The graph below is for Chic and Sharpe Ltd., a firm in the women's garment industry, which is monopolistically competitive. Cost and
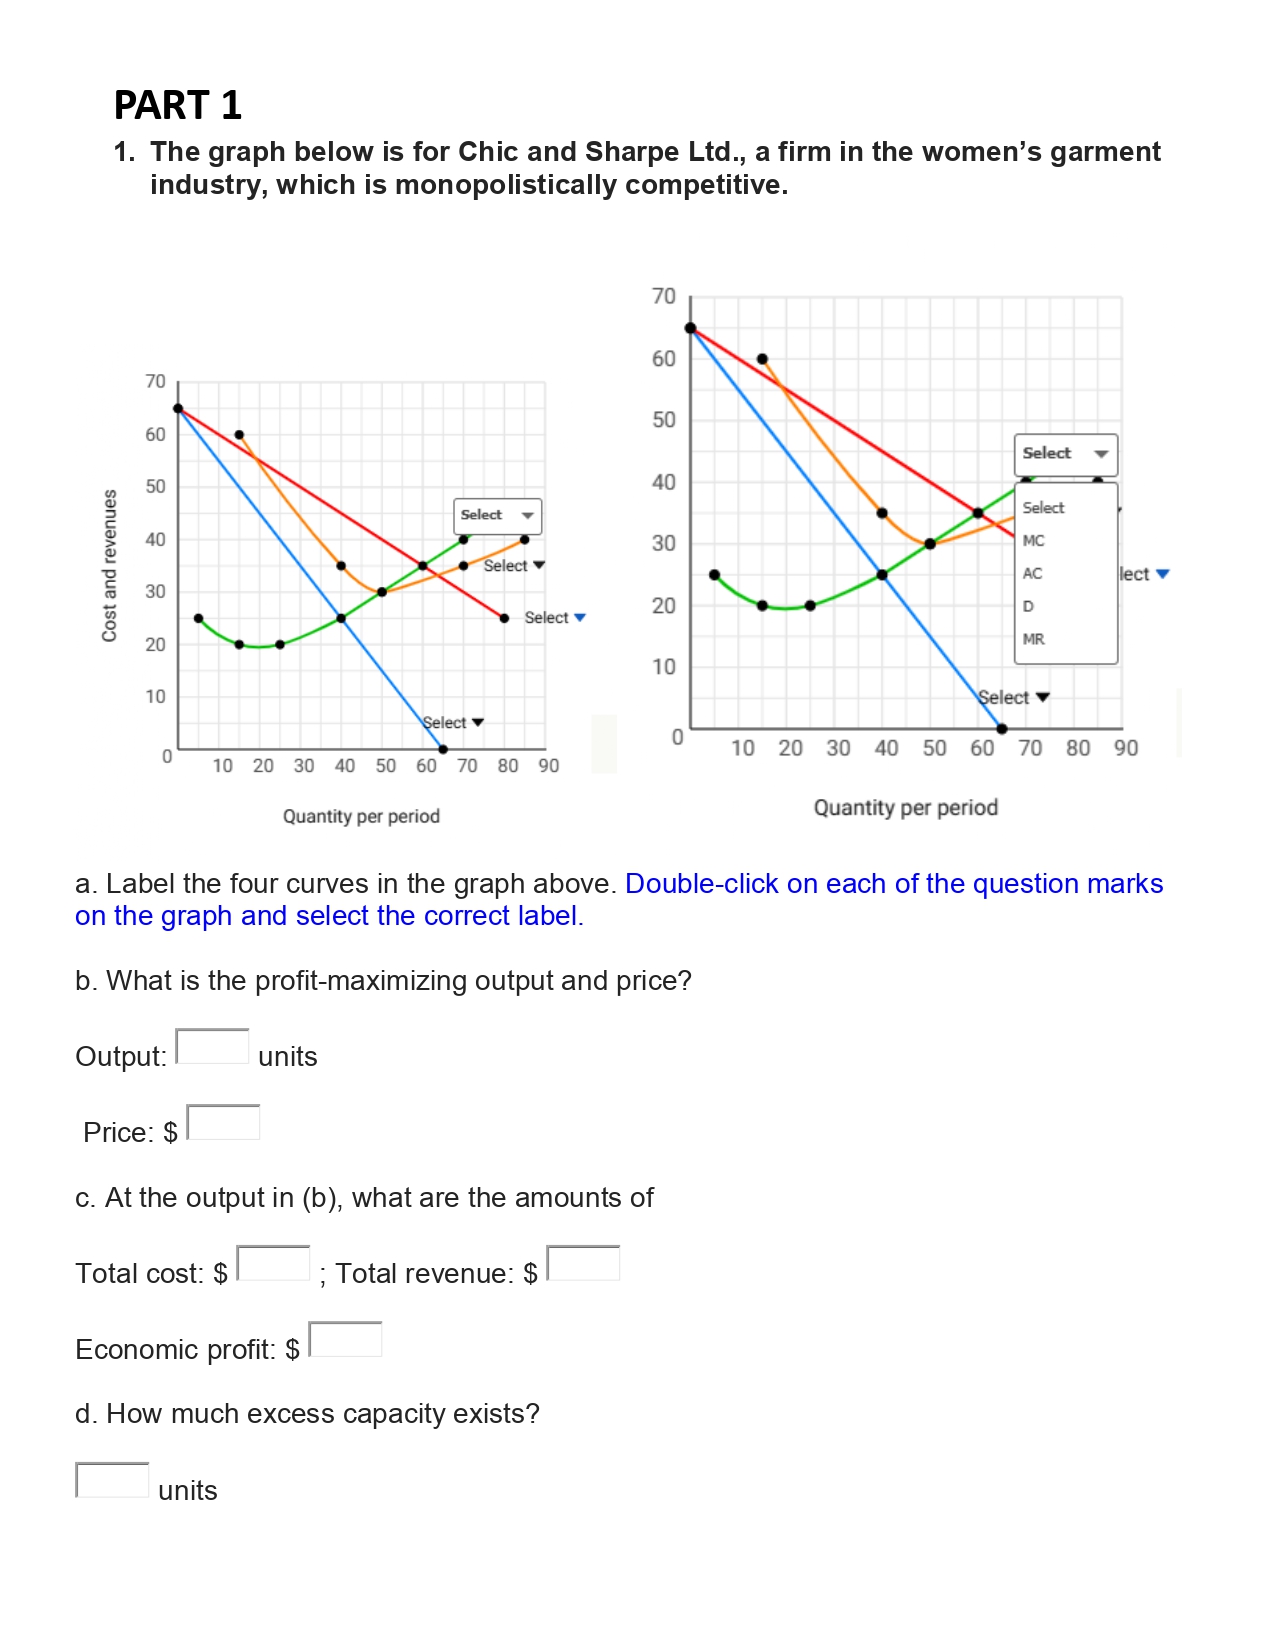


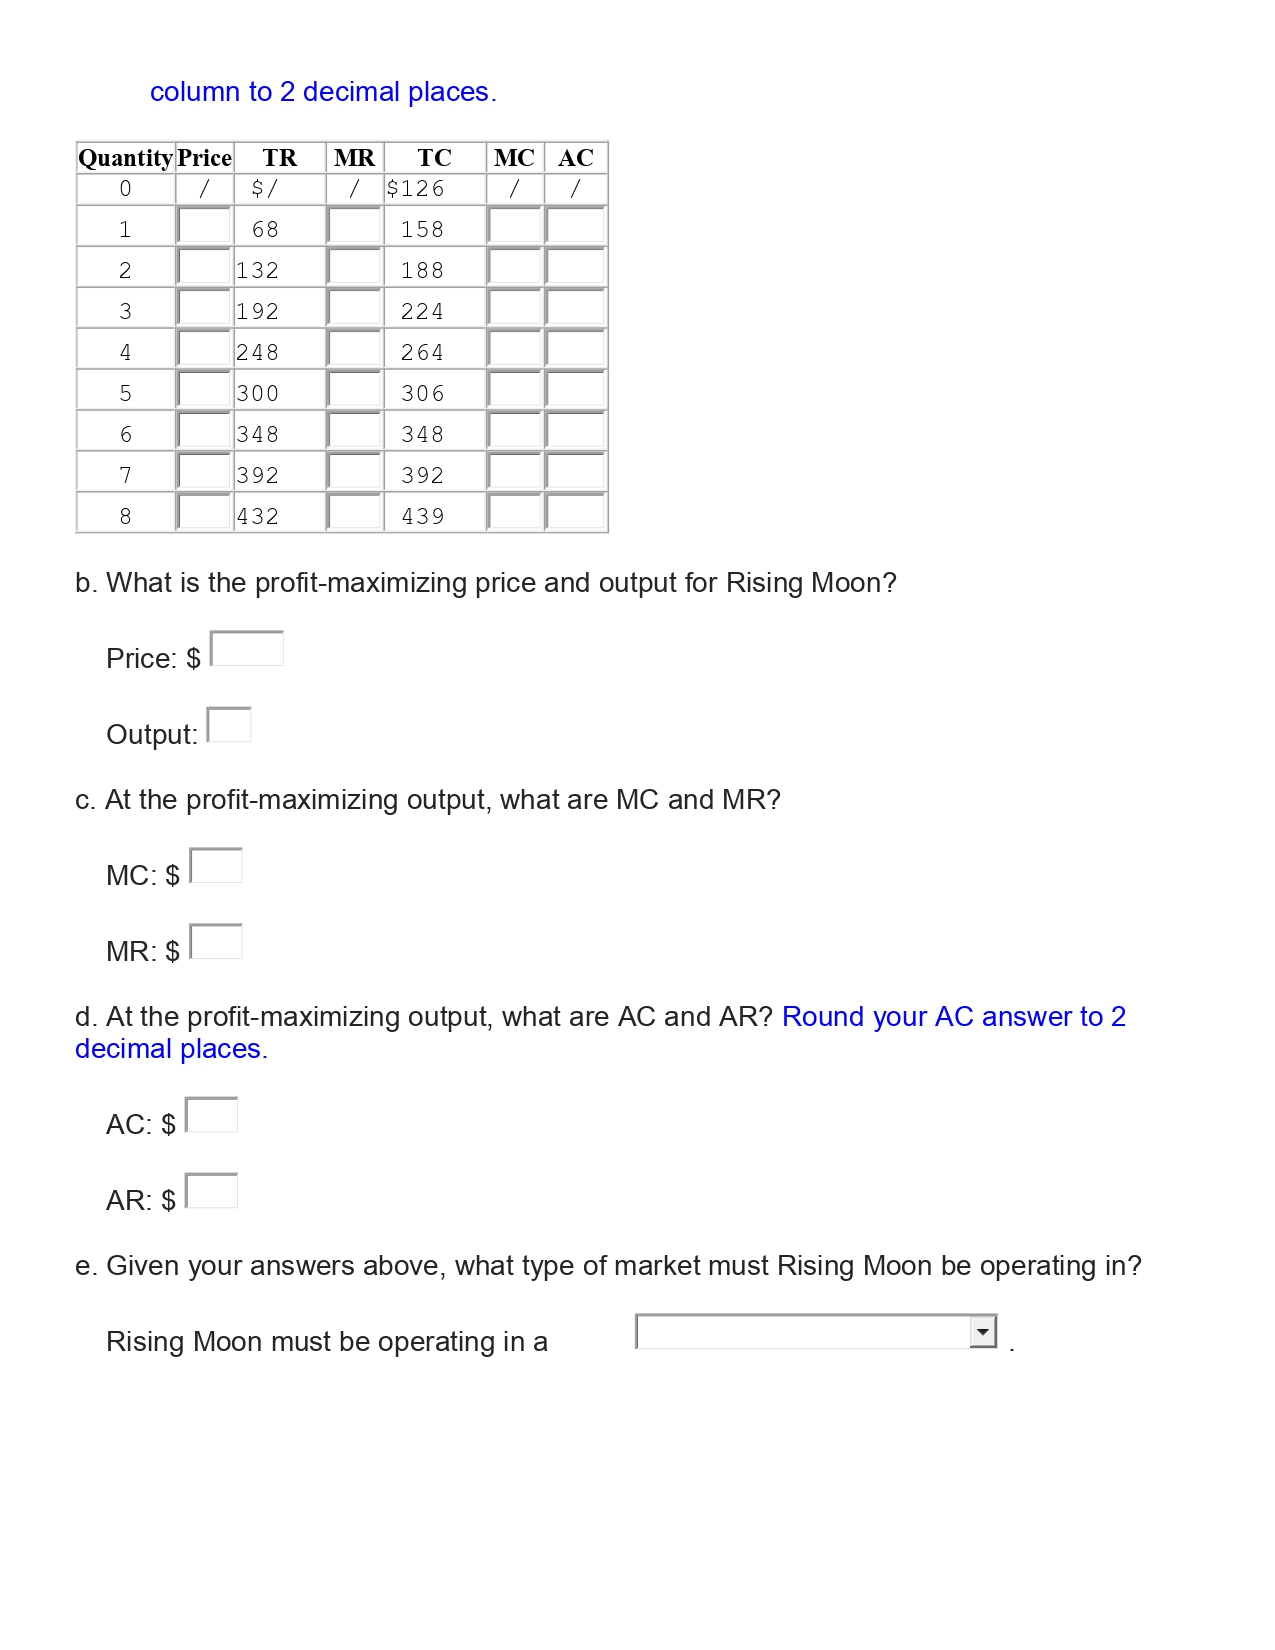


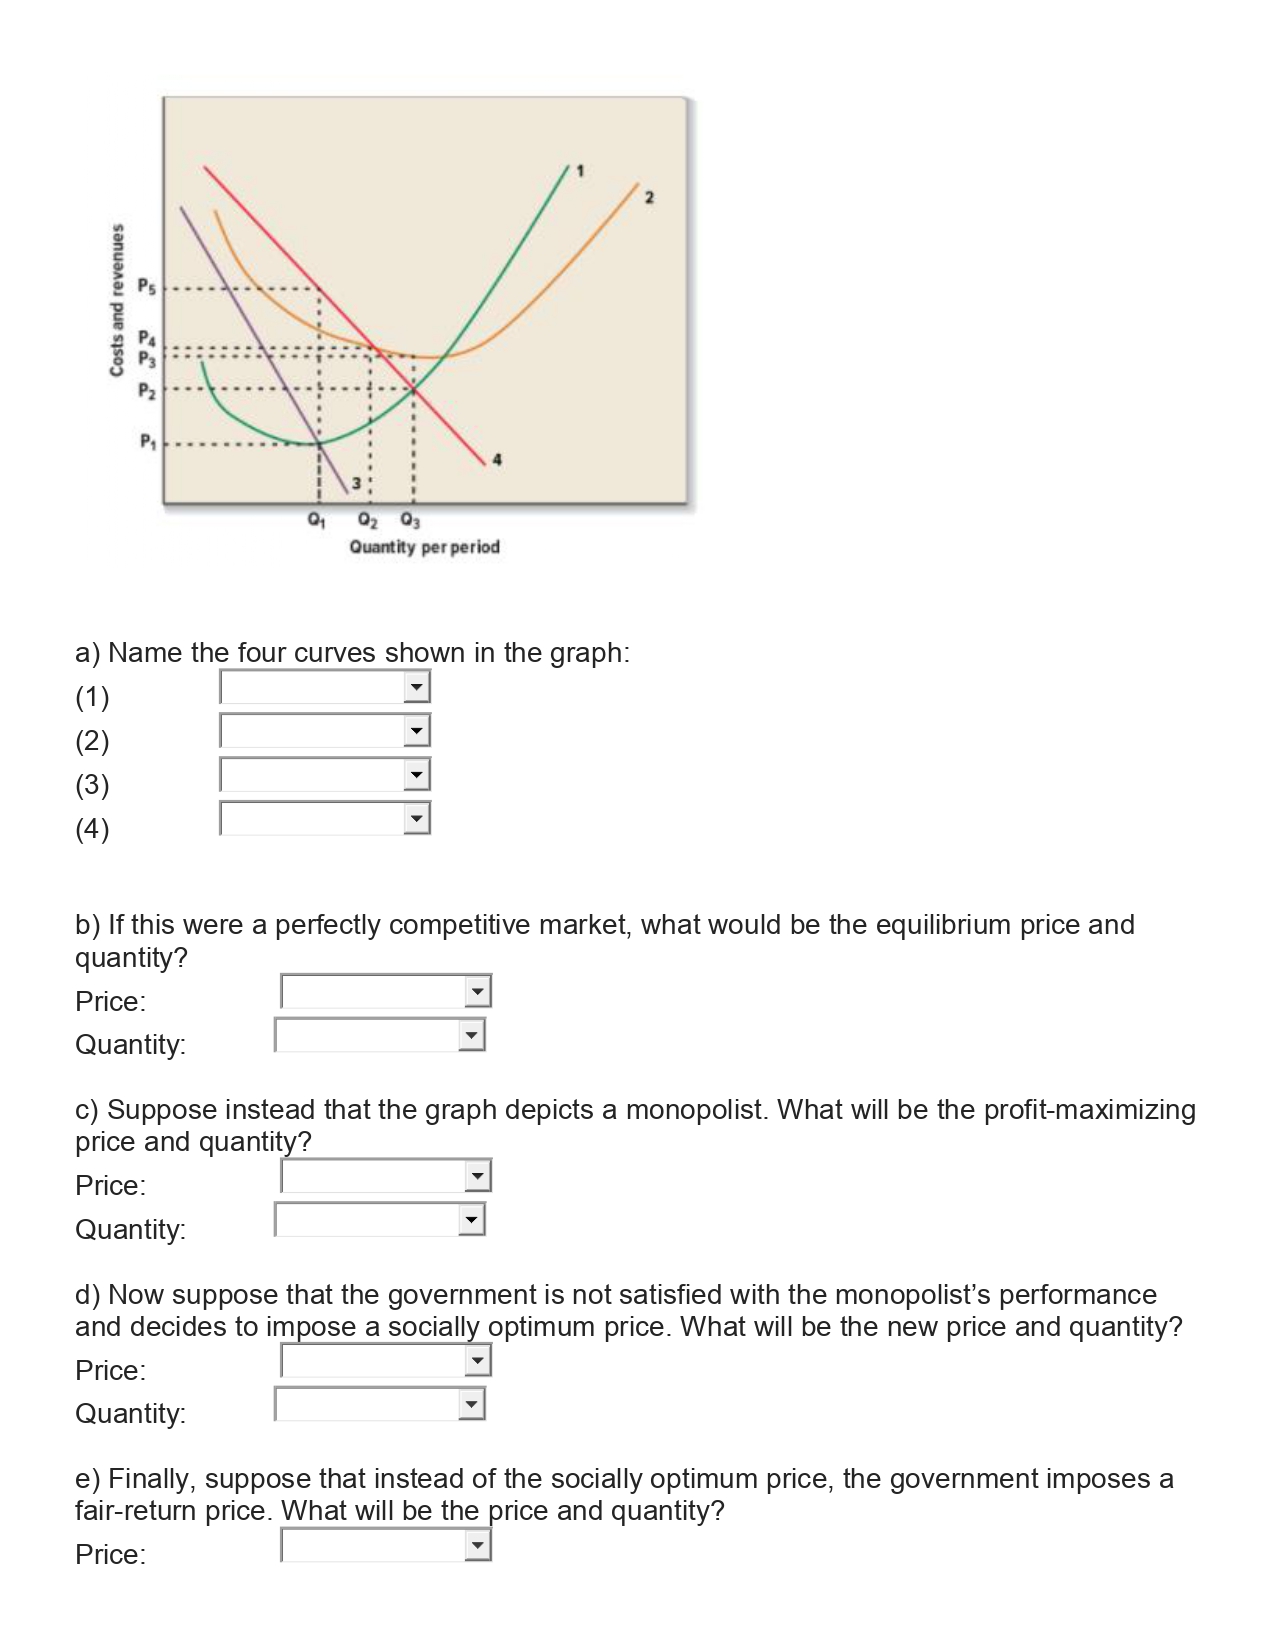


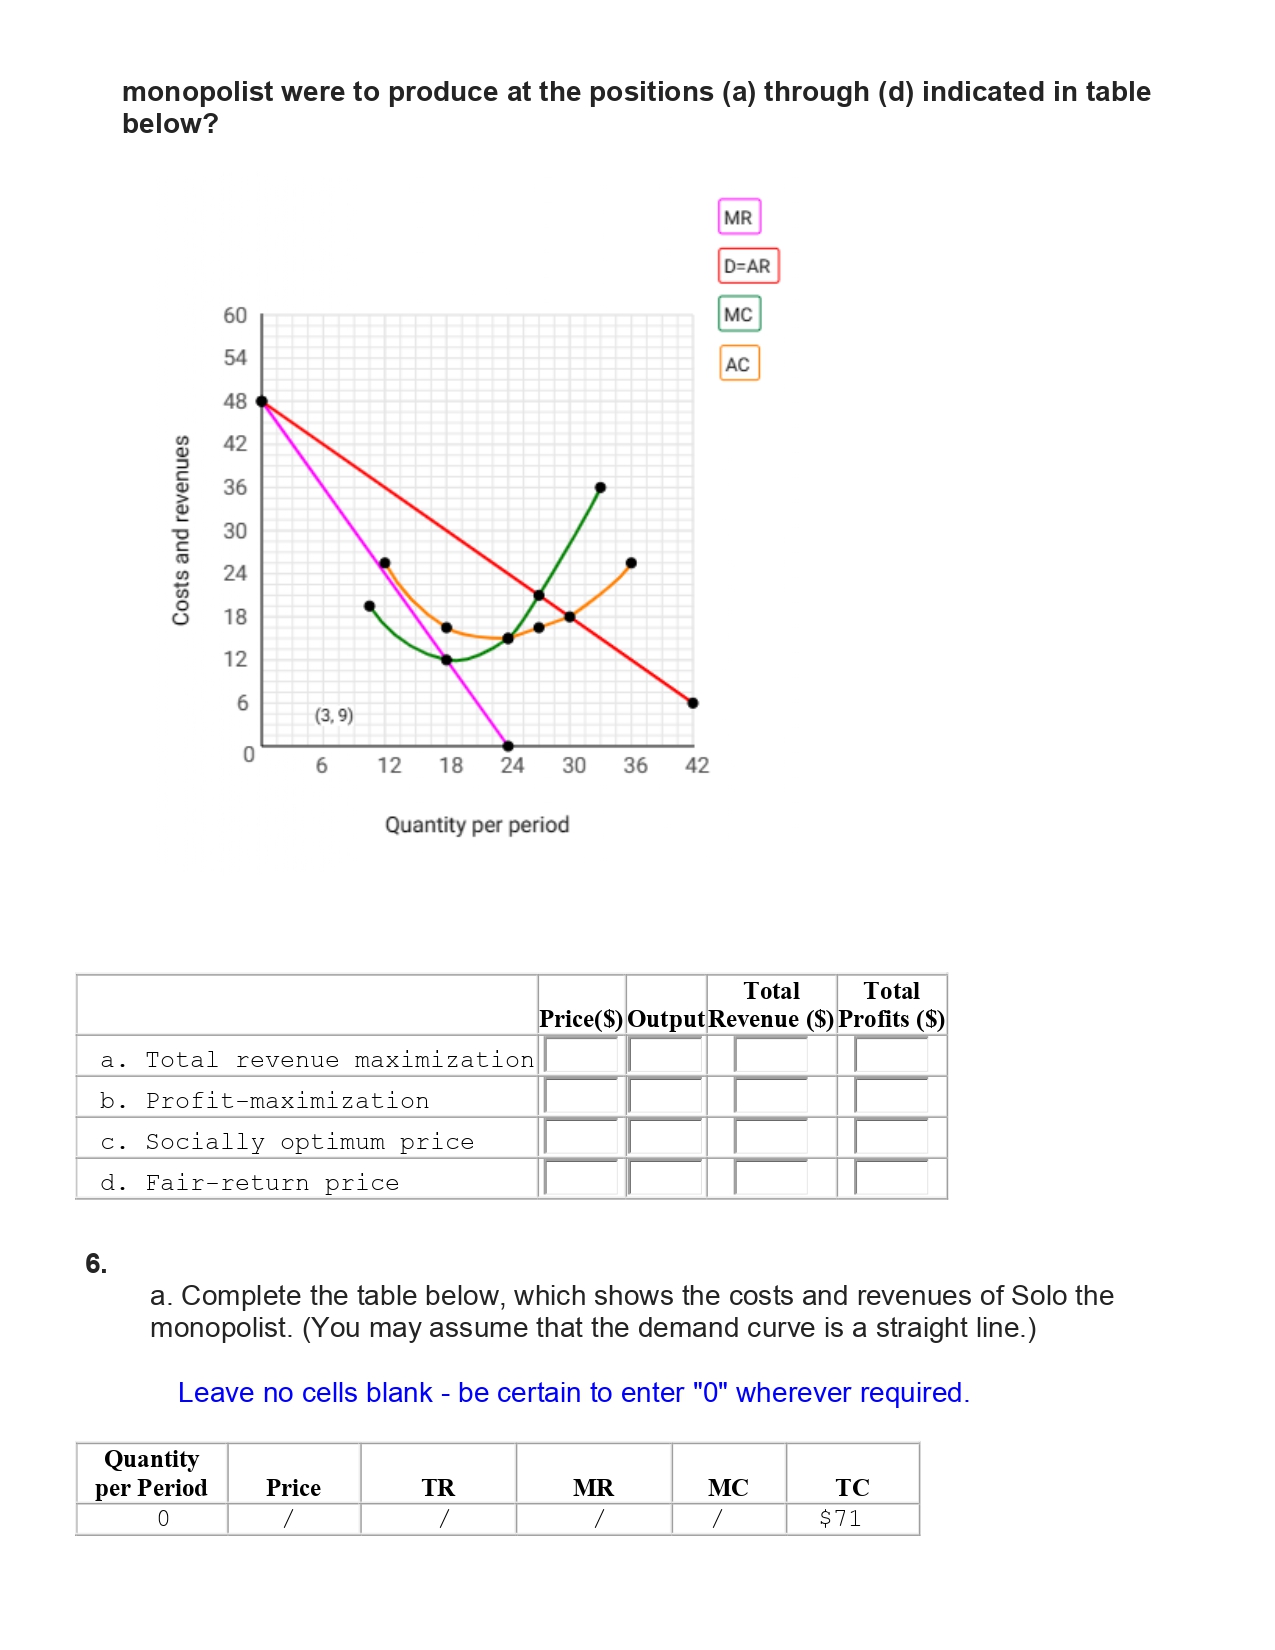
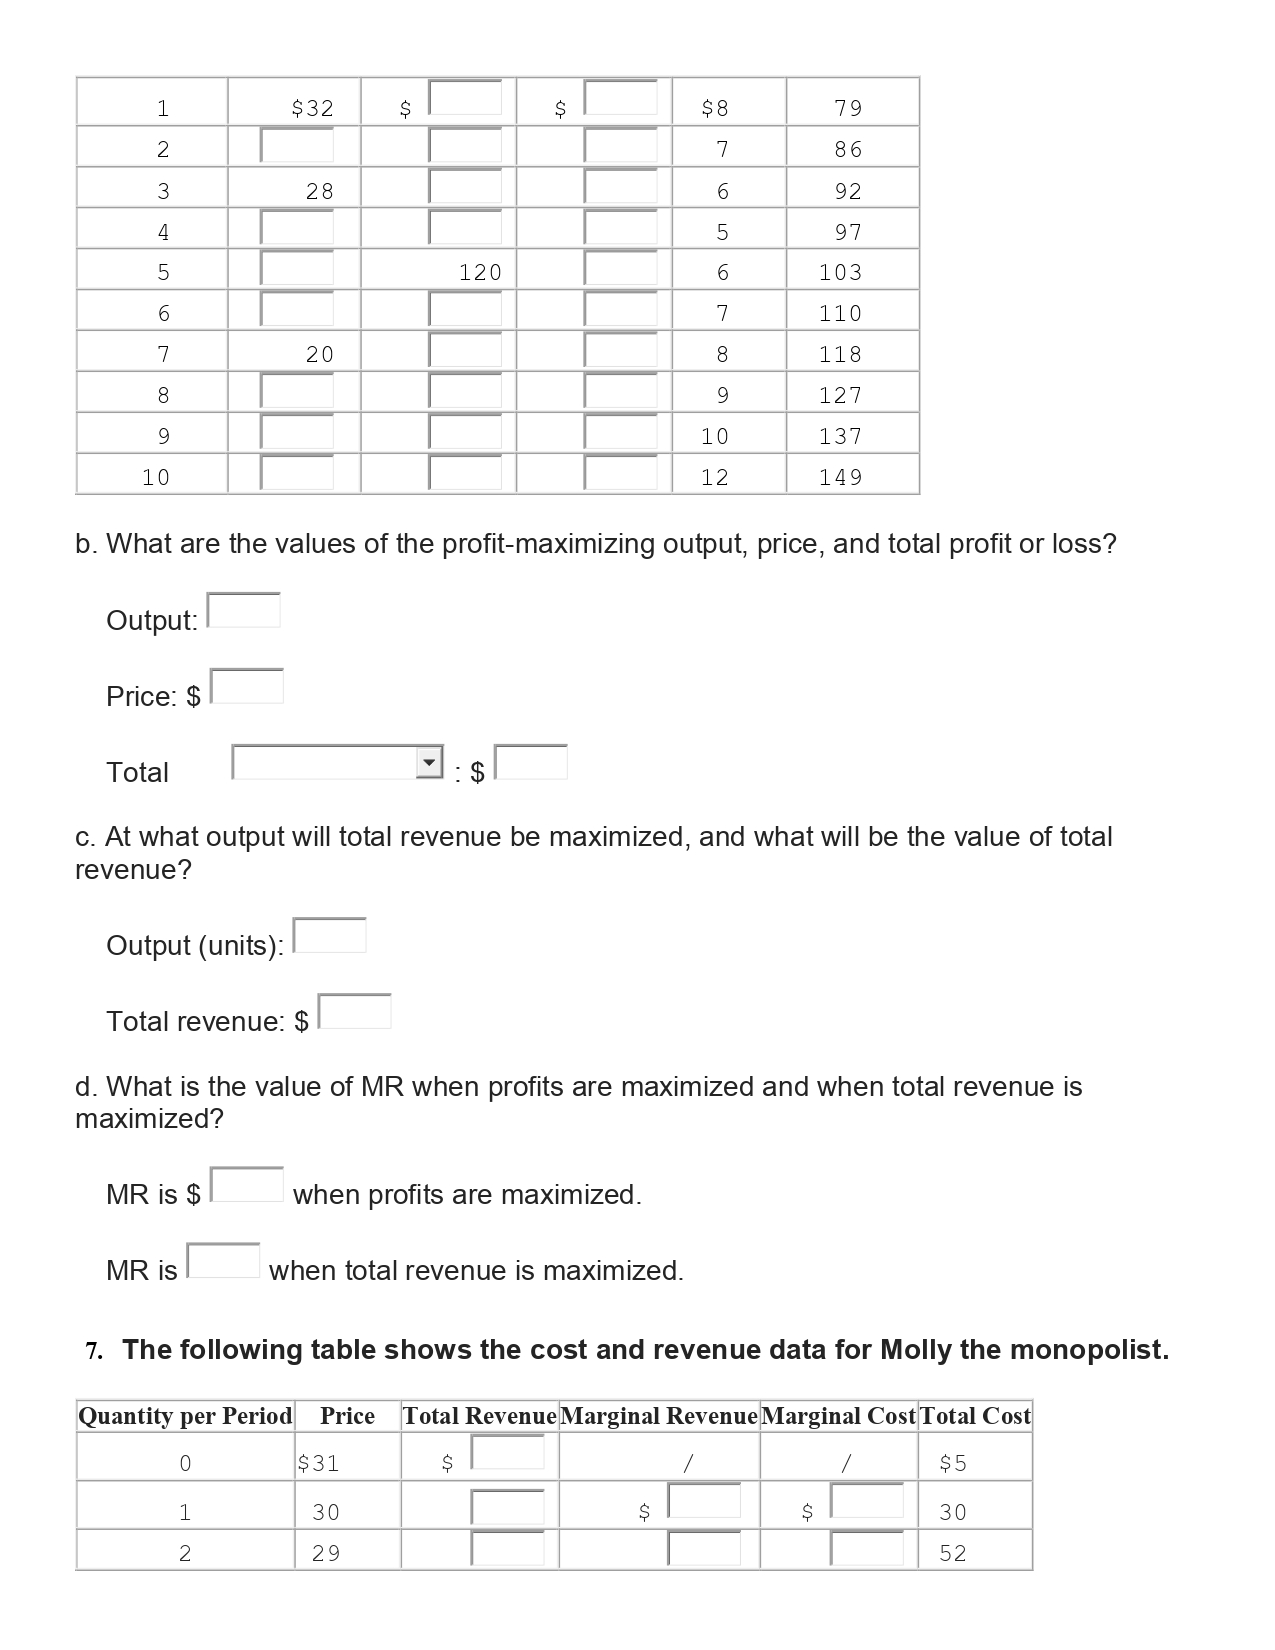


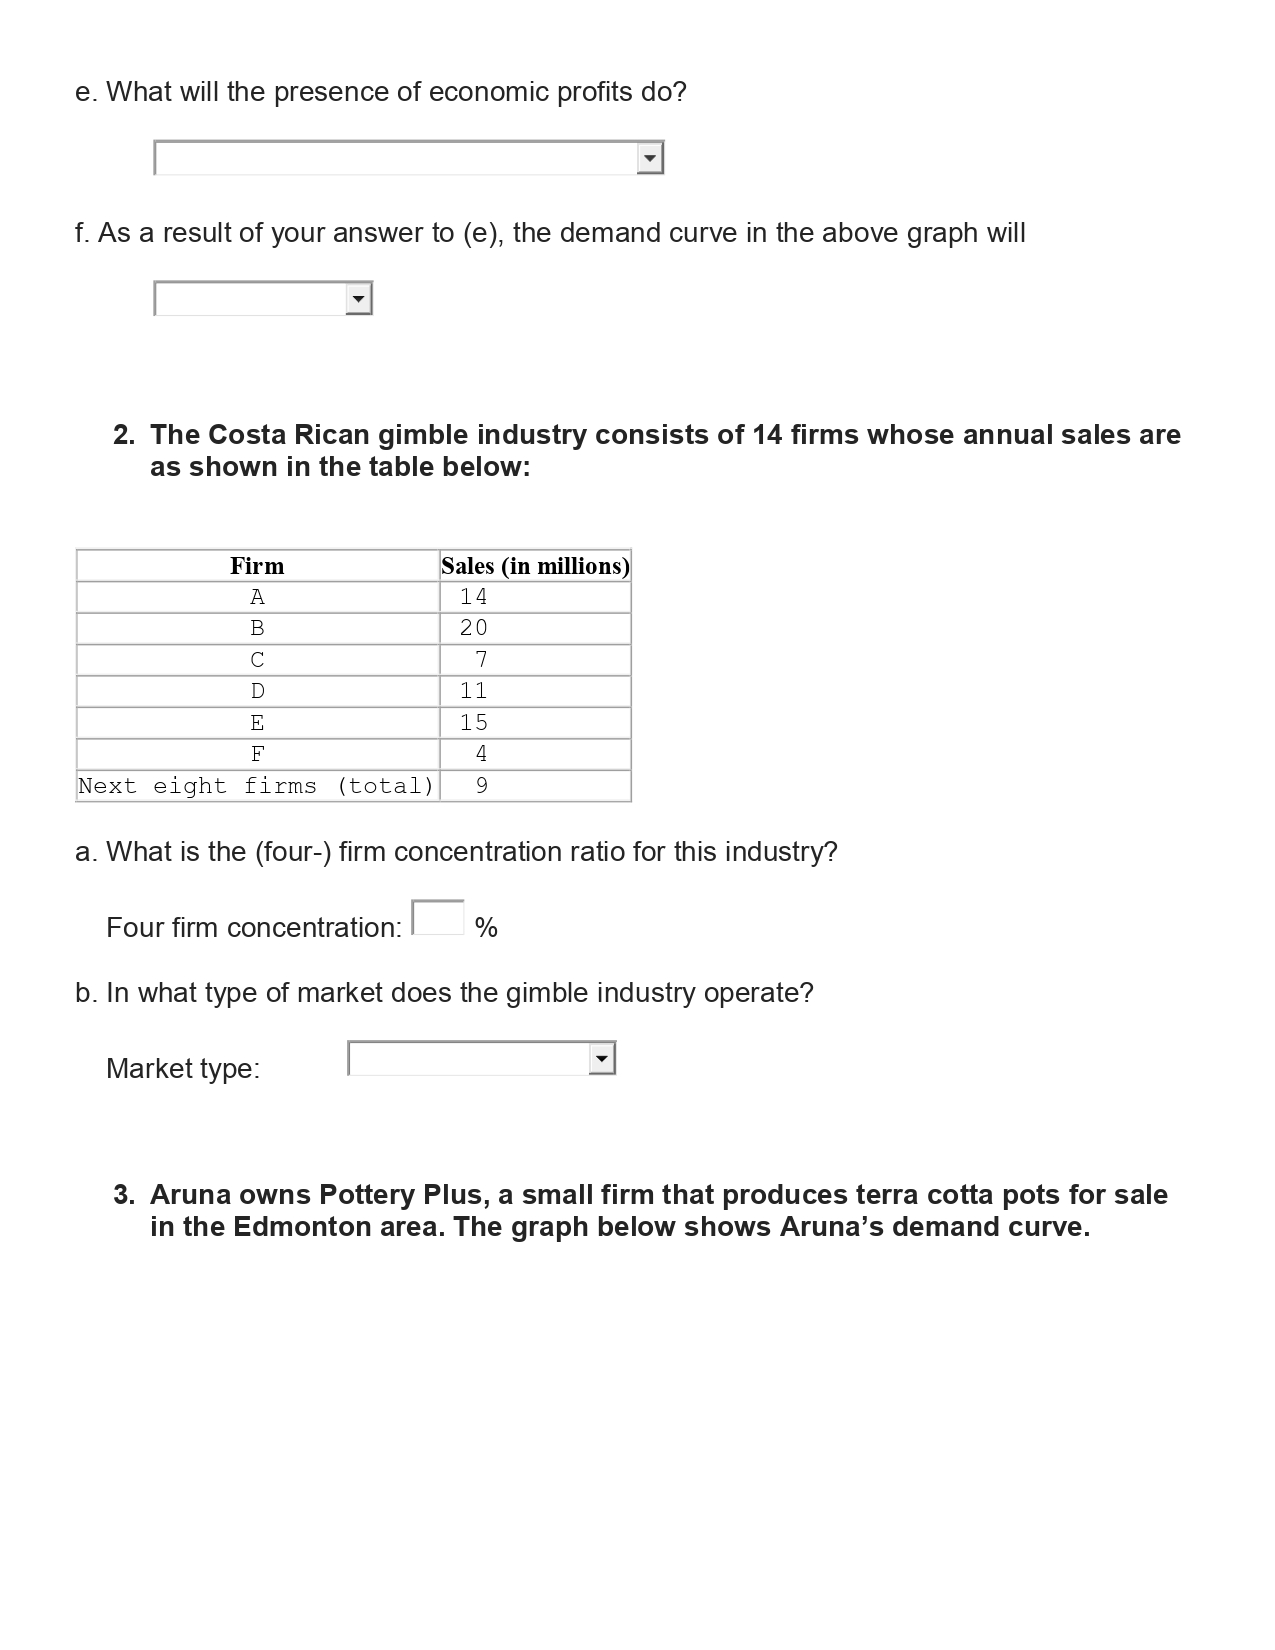
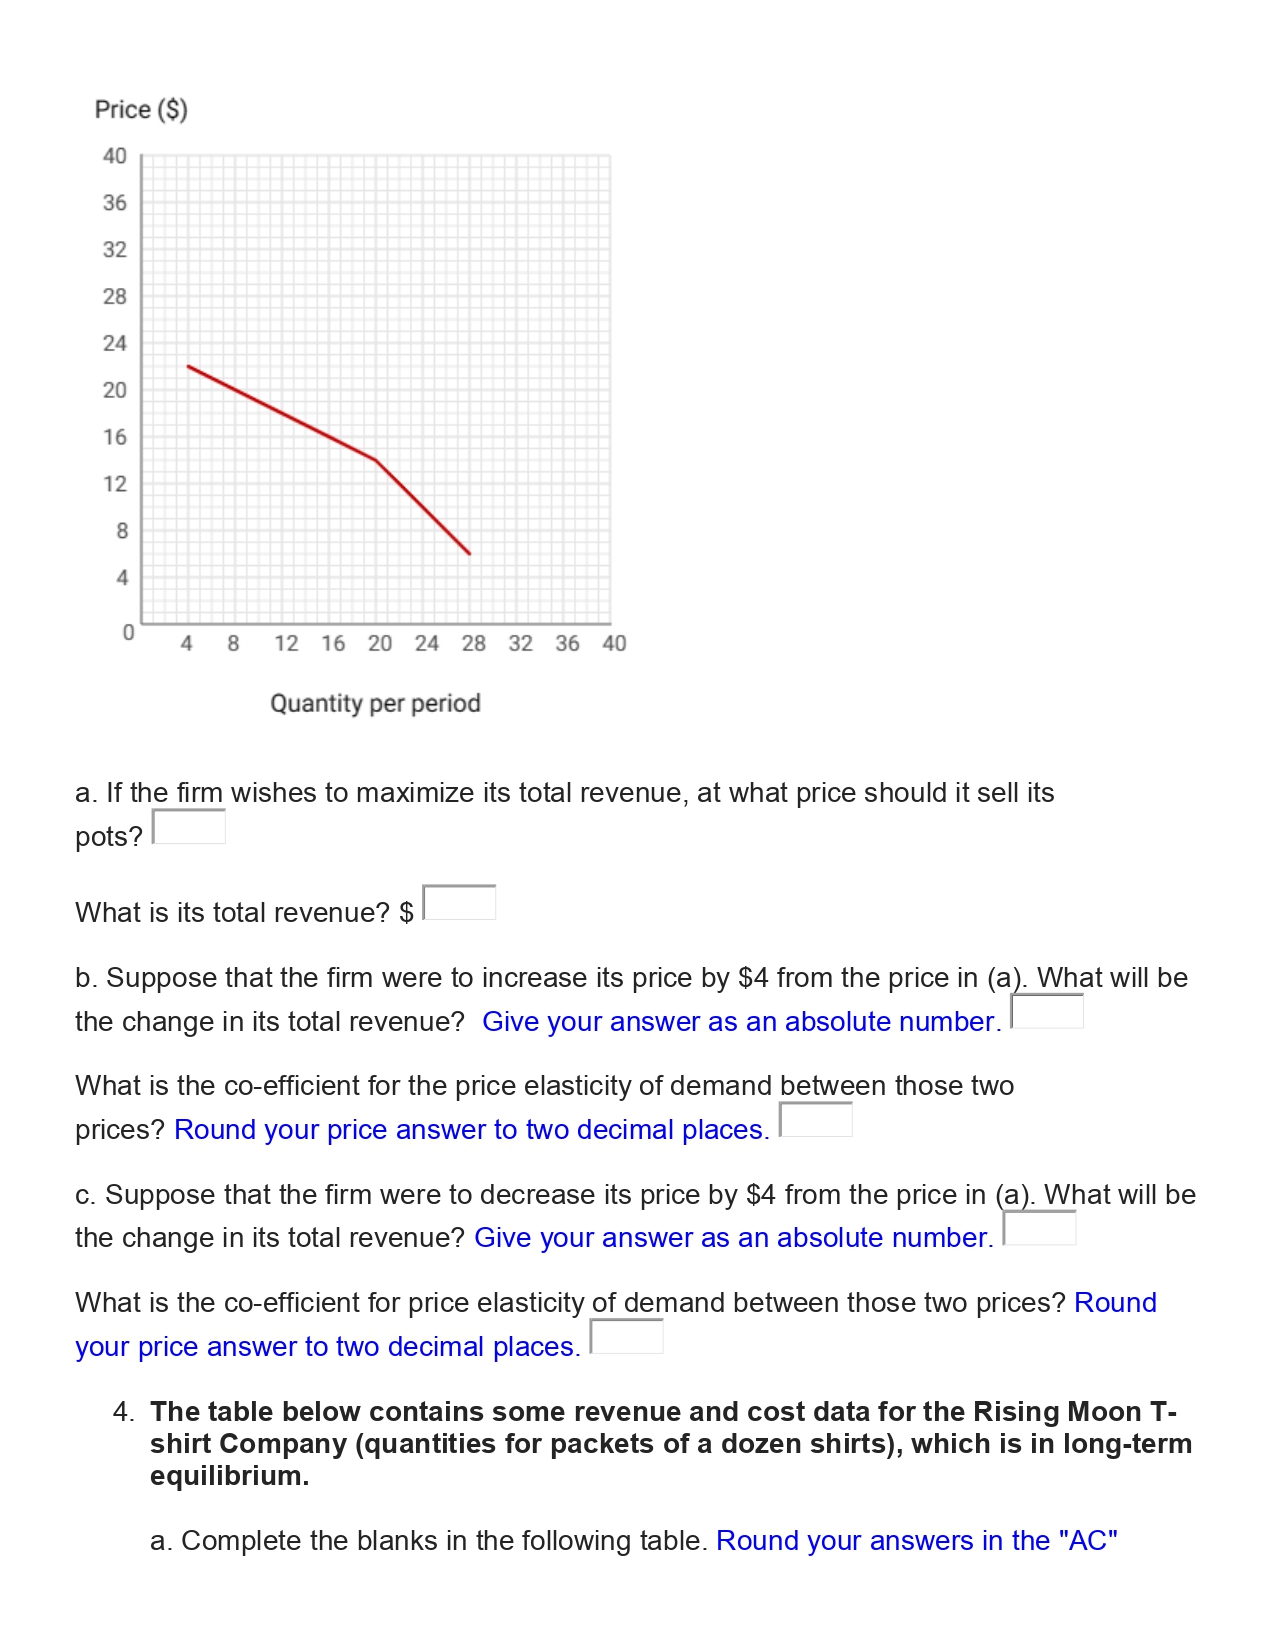

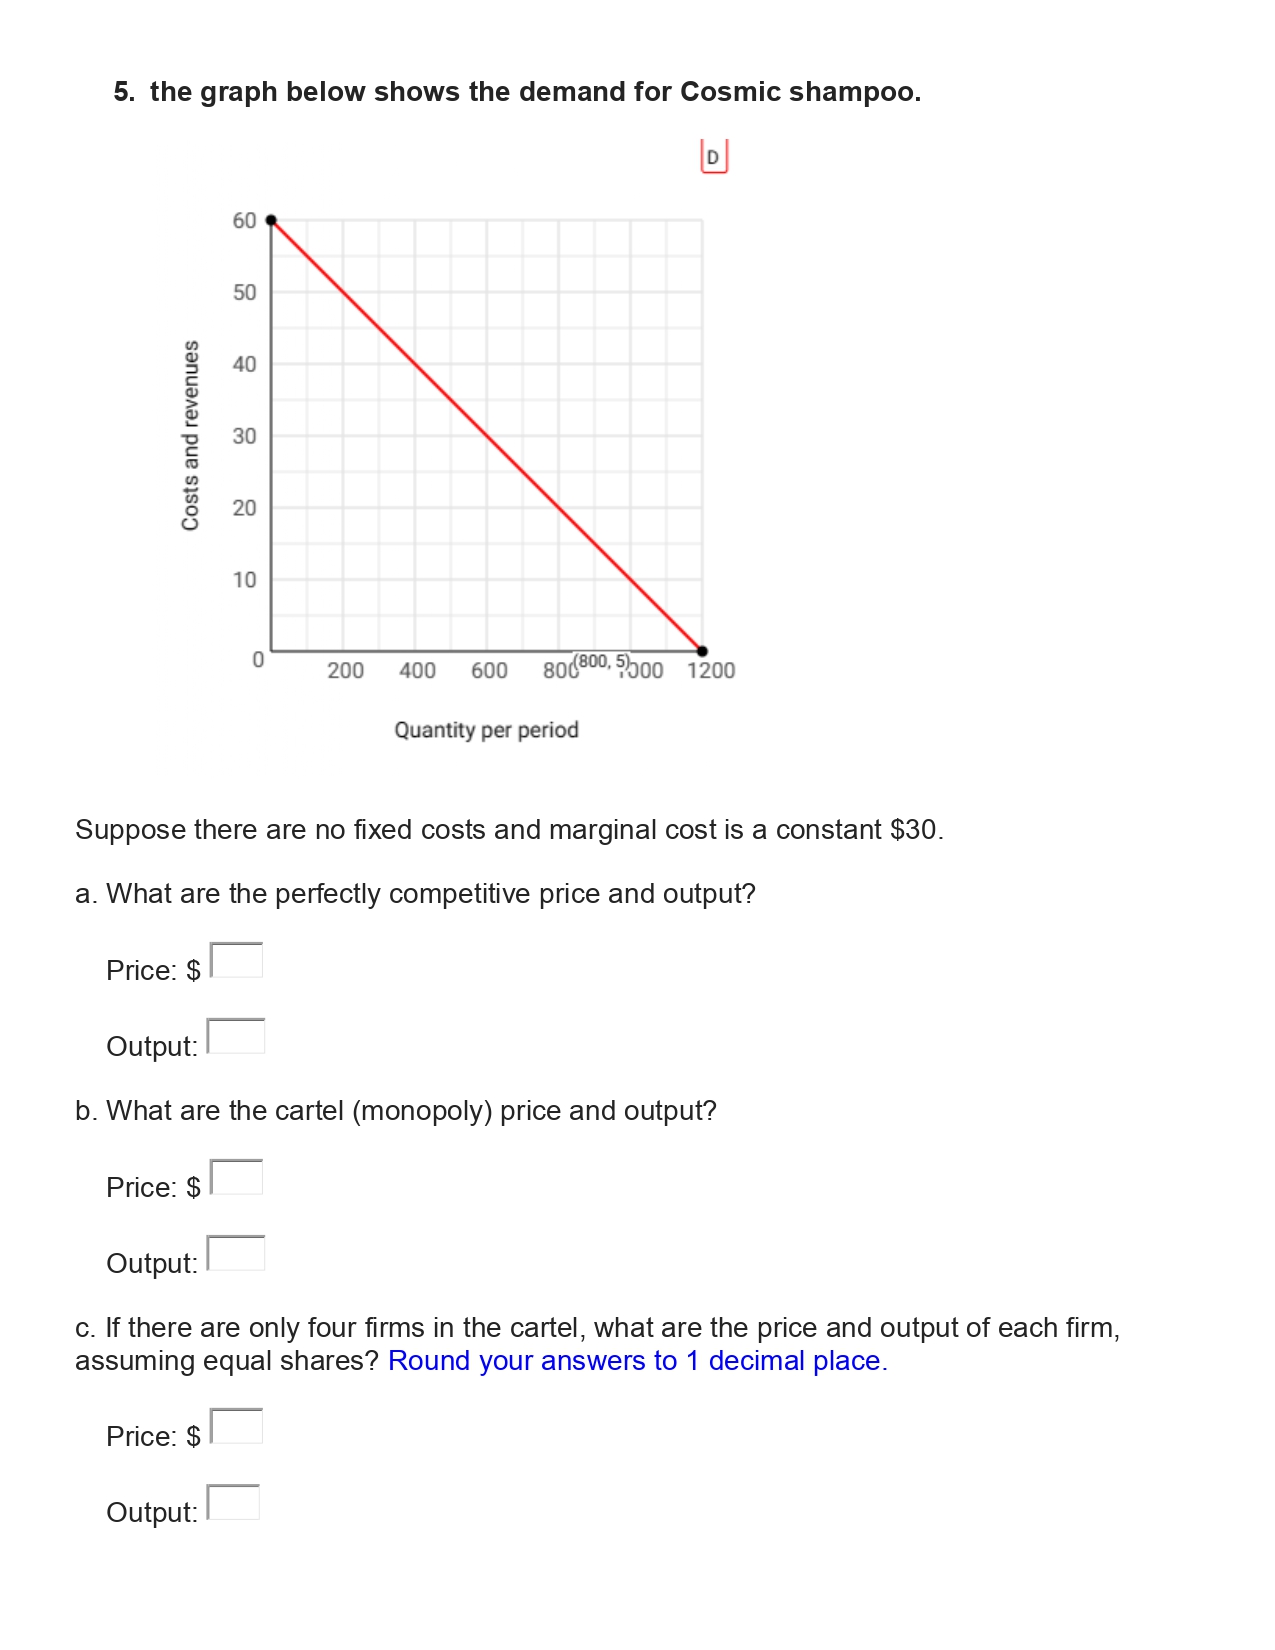
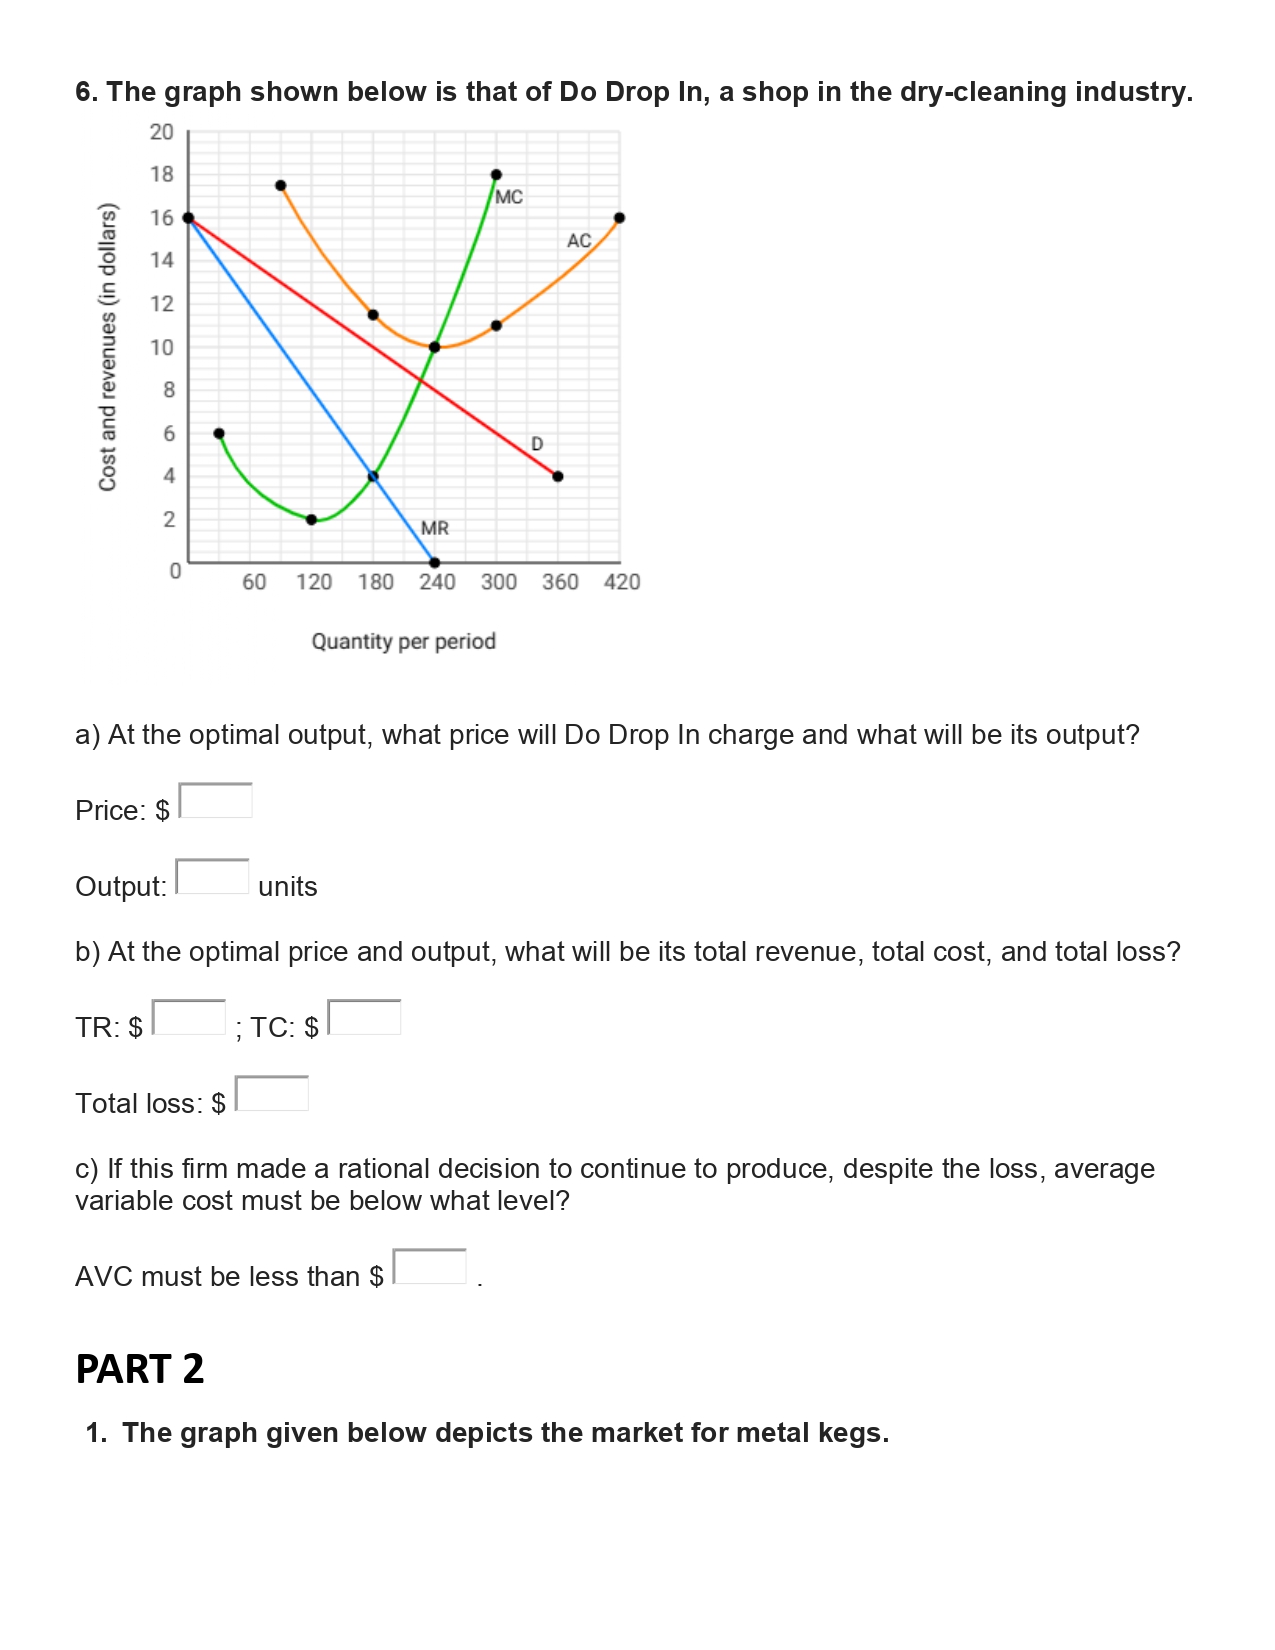


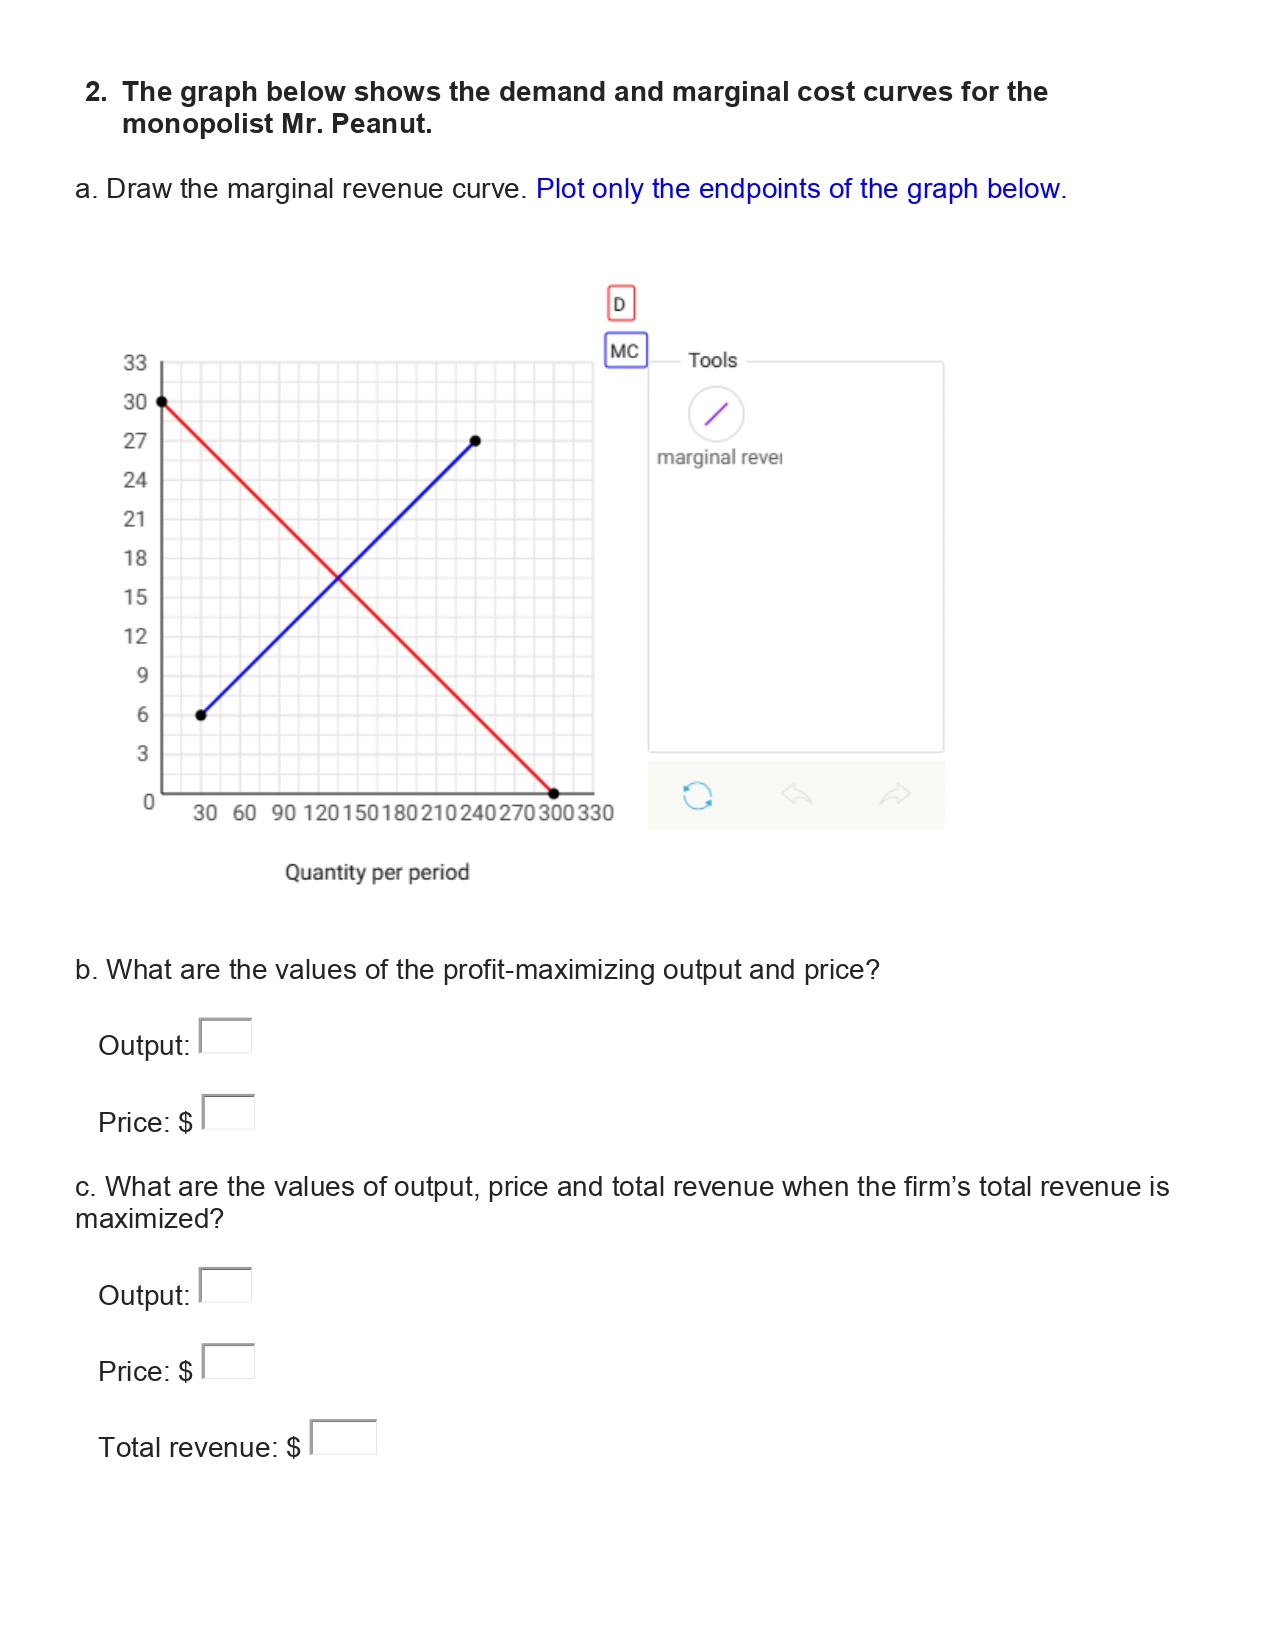
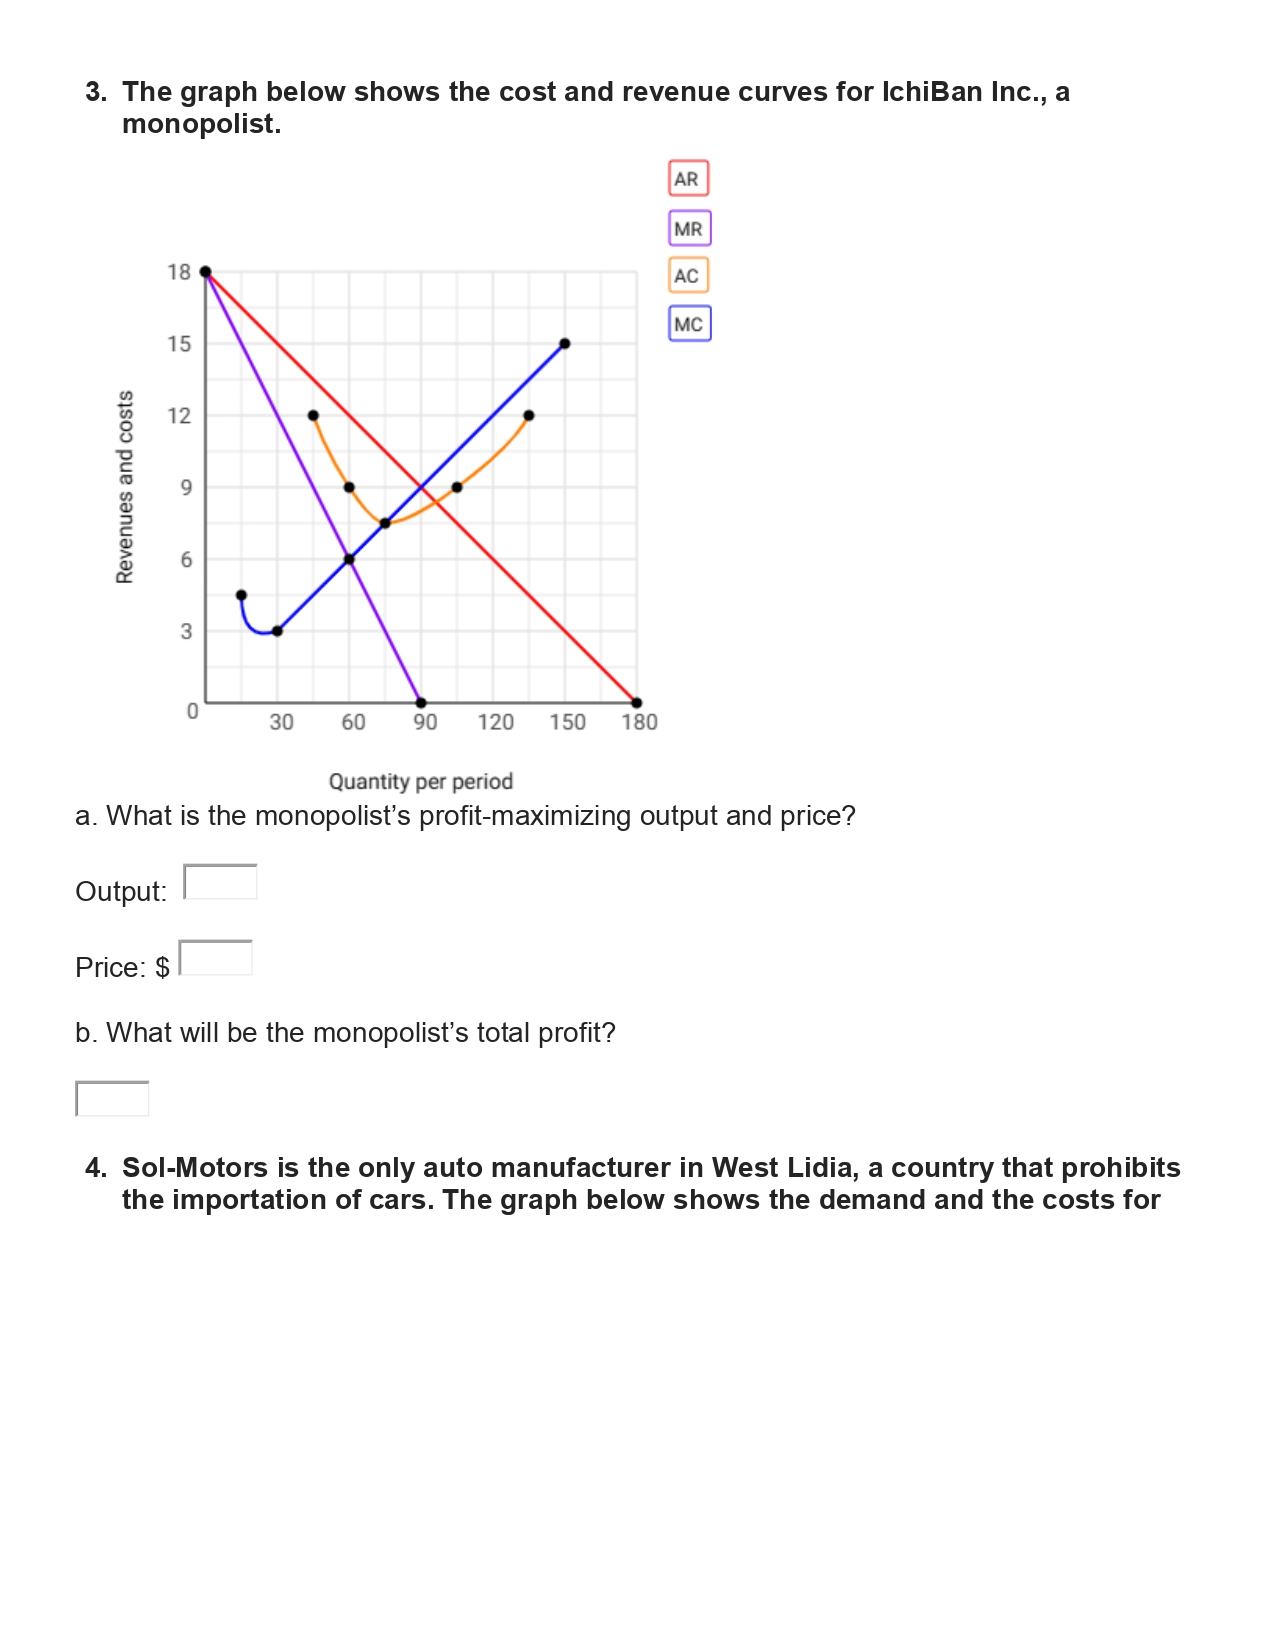
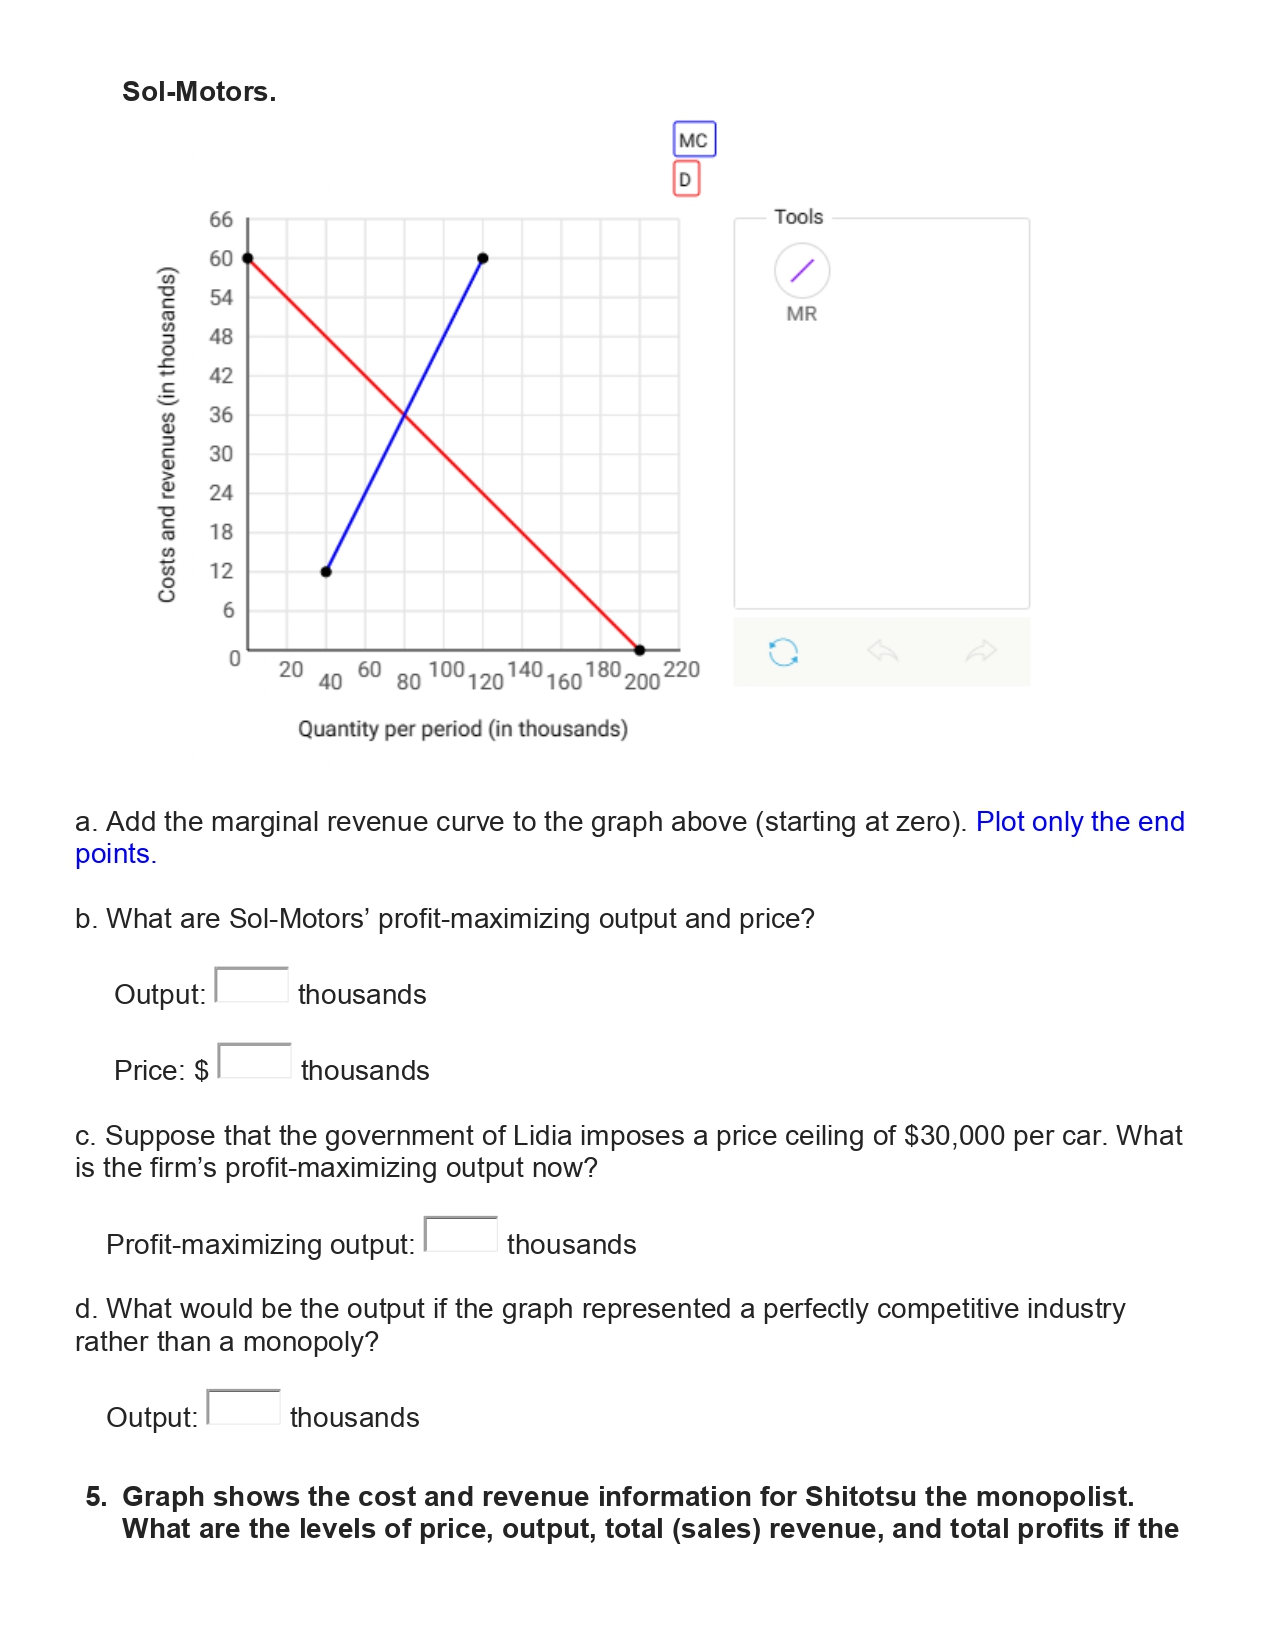


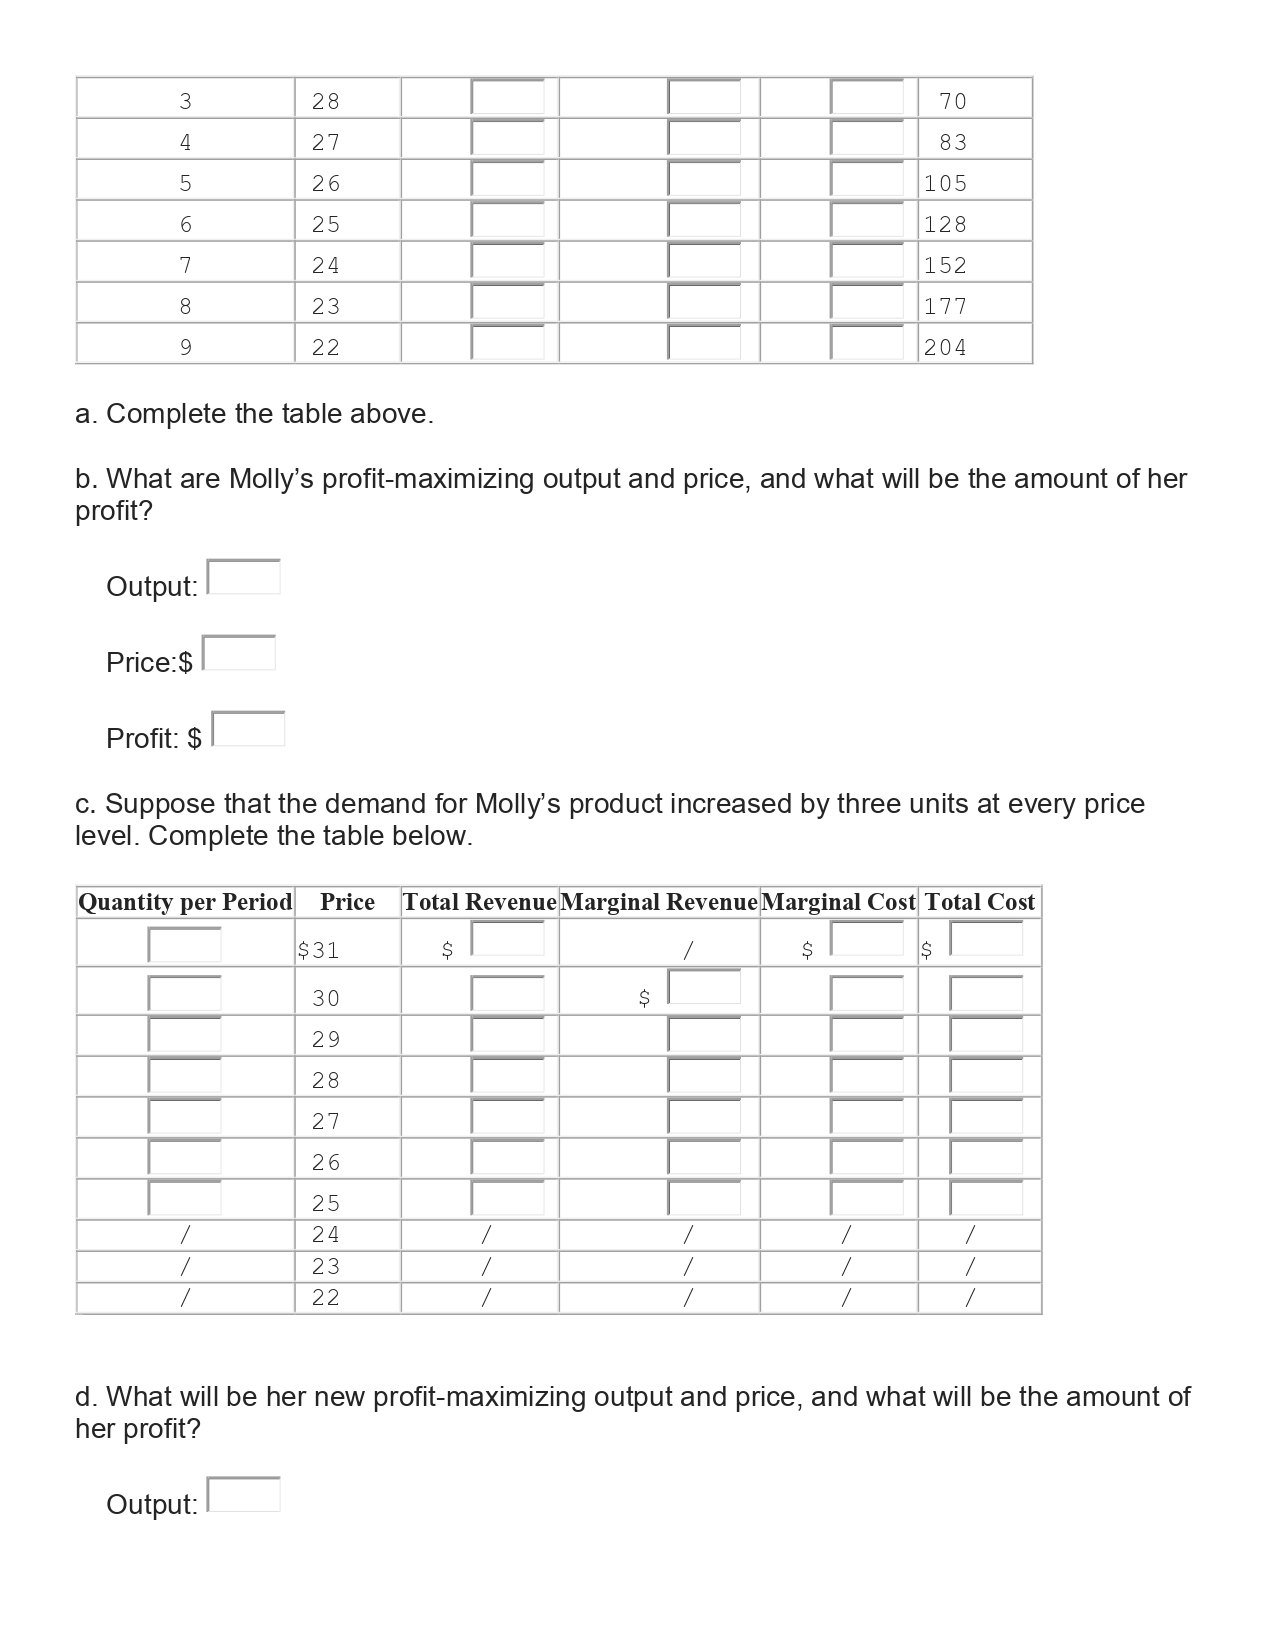
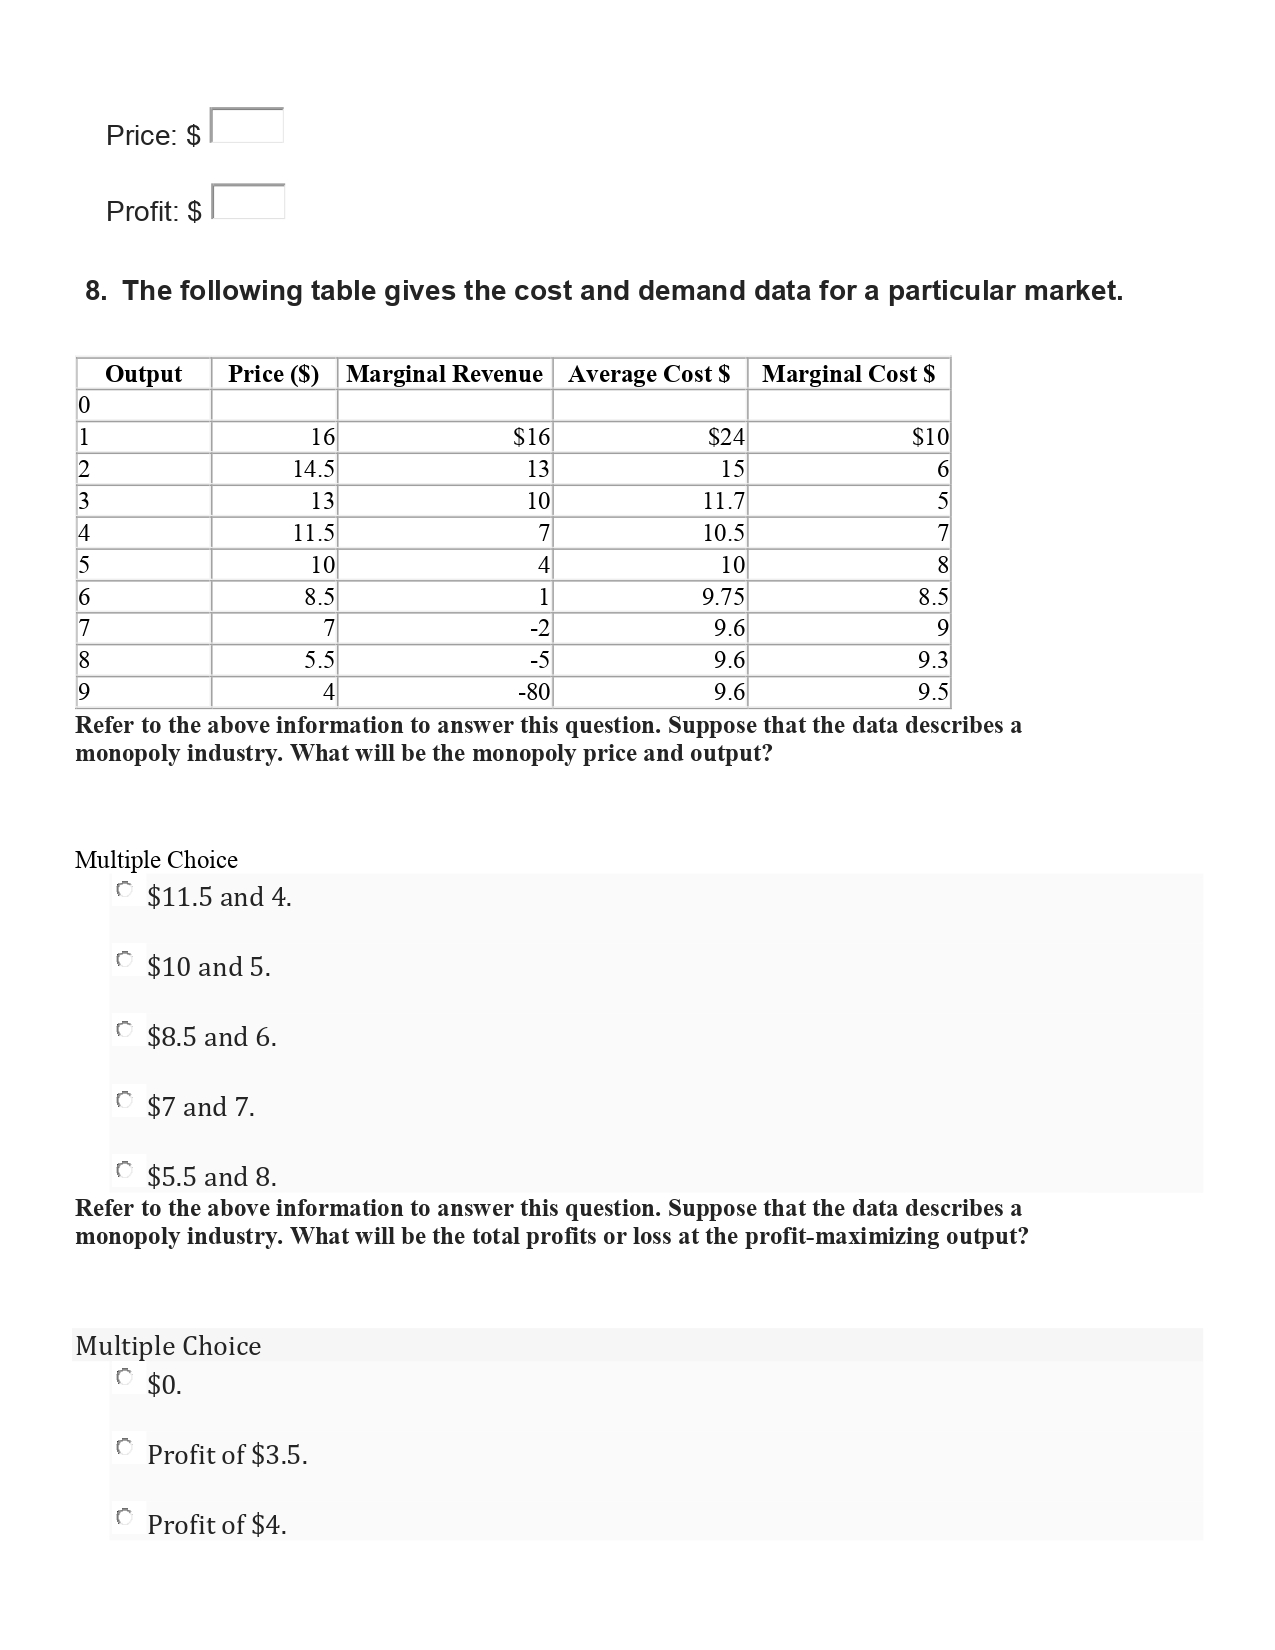
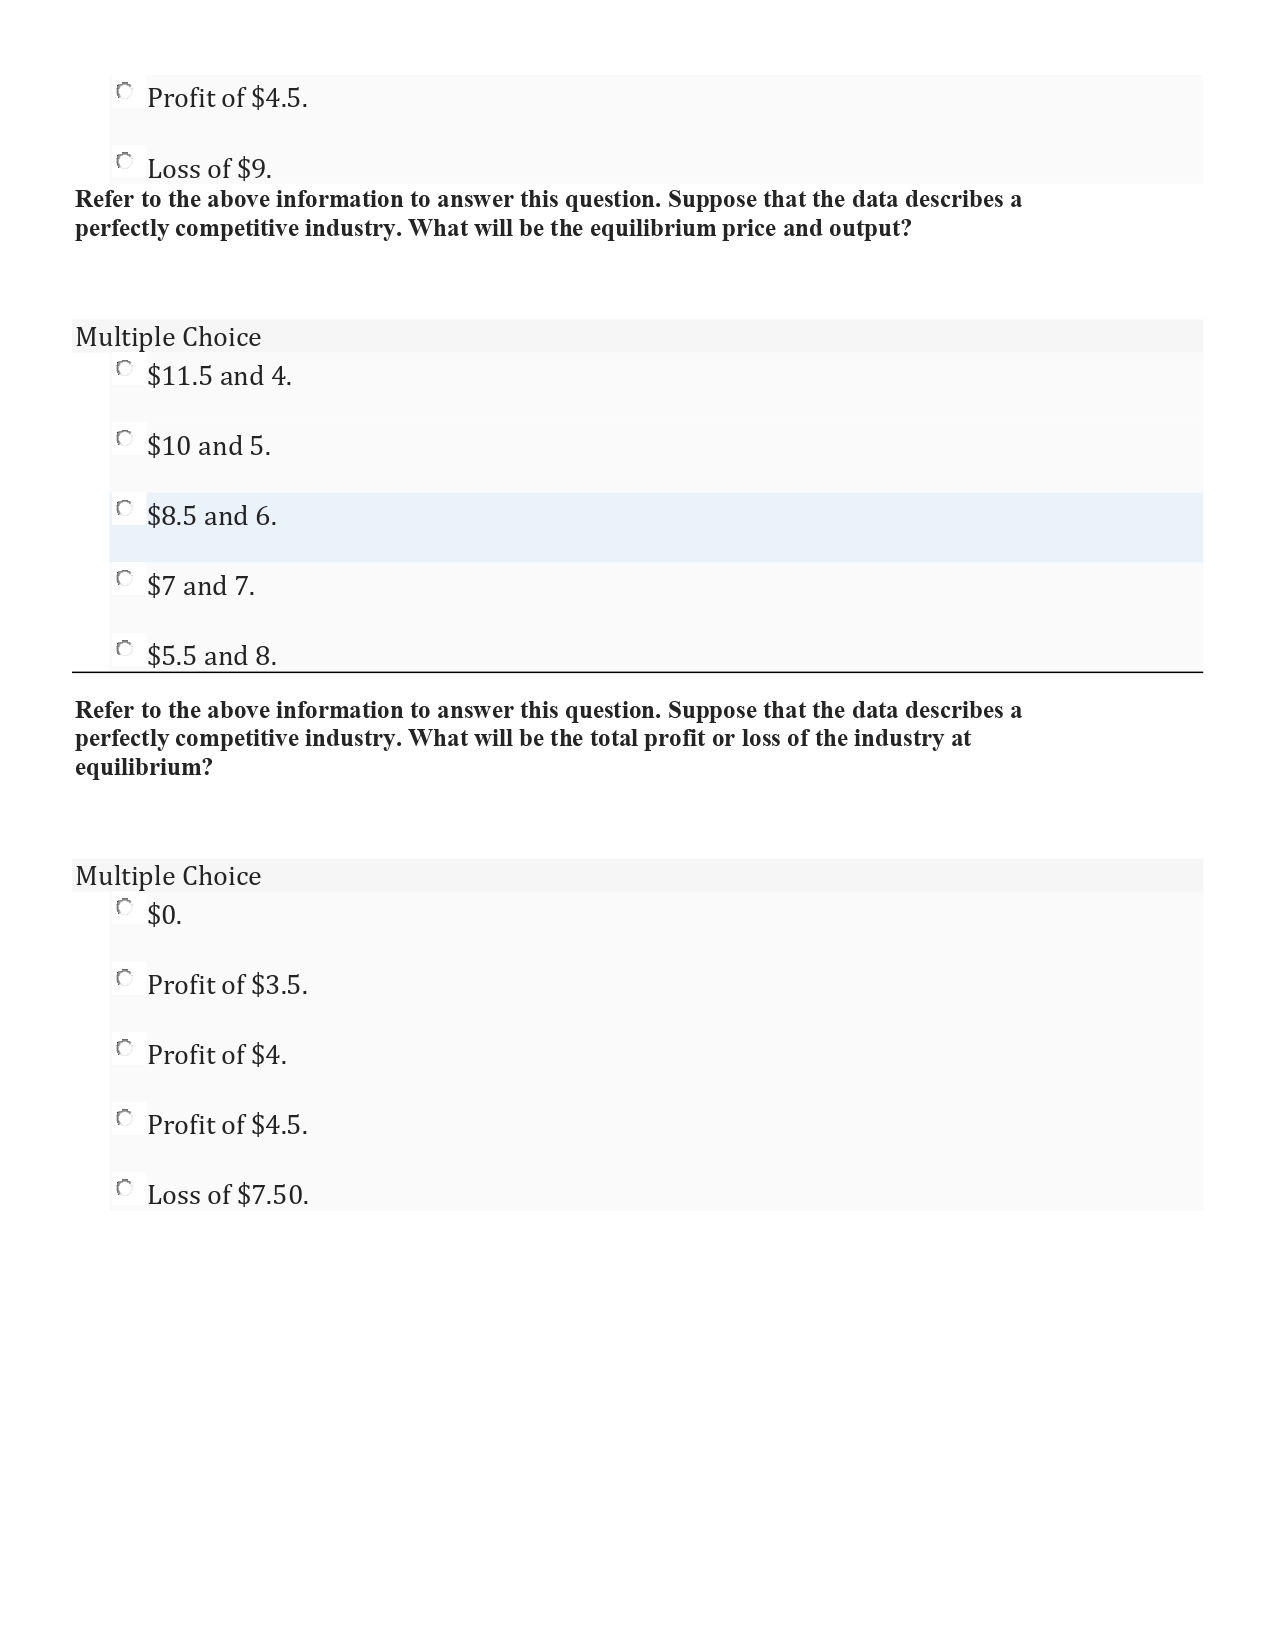
PART 1 1. The graph below is for Chic and Sharpe Ltd., a firm in the women's garment industry, which is monopolistically competitive. Cost and revenues 10 20 3O 4O 50 60 70 80 90 10 20 30 4O 50 60 70 80 90 Quantity per period Quantity per period a. Label the four curves in the graph above. Double-click on each of the question marks on the graph and select the correct label. b. What is the profit-maximizing output and price? 0. At the output in (b), what are the amounts of Total cost: $ I ; Total revenue: $ Economic profit: $ d. How much excess capacity exists? units e. What will the presence of economic profits do? l d f. As a result of your answer to (e), the demand curve in the above graph will i v 2. The Costa Rican gimble industry consists of 14 firms whose annual sales are as shown in the table below: Firm Sales (in millions) A 14 3 20 C 7 D 11 E 15 ? 4 Next eight firms (total) 9 a. What is the (four) firm concentration ratio for this industry? Four firm concentration: l % b. In what type of market does the gimble industry operate? Market type: 3 3. Aruna owns Pottery Plus, a small firm that produces terra cotta pots for sale in the Edmonton area. The graph below shows Aruna's demand curve. Price (3) 40 36 32 28 24 20 16 12 8 4 0' 481216202428323640 Quantity per period a. Ifthe rm wishes to maximize its total revenue, at what price should it sell its pots? What is its total revenue? $ ' b. Suppose that the firm were to increase its price by $4 from the price in (a). What will be the change in its total revenue? Give your answer as an absolute number. What is the coefficient for the price elasticity of demand between those two prices? Round your price answer to two decimal places. 0. Suppose that the firm were to decrease its price by $4 from the price in (a). What will be the change in its total revenue? Give your answer as an absolute number. l What is the coefficient for price elasticity of demand between those two prices? Round your price answer to two decimal places. 4. The table below contains some revenue and cost data for the Rising Moon T- shirt Company (quantities for packets of a dozen shirts), which is in long-term equilibrium. a. Complete the blanks in the following table. Round your answers in the "AC" column to 2 decimal places. QuantityPrice TR MR TC IMC AC 0 / $/ / $__26 | / / 1 I 68 If __58 lIl 2 I132 I ,,88 lll 3 I192 I 224 lll 4 I248 ' 264 llI 5 I300 ' 306 lll 6 I348 ' 348 lll 7 I392 I 392 lll 8 I432 I 439 lll b. What is the protmaximizing price and output for Rising Moon? d. At the profit-maximizing output, what are AC and AR? Round your AC answer to 2 decimal places. e. Given your answers above, what type of market must Rising Moon be operating in? Rising Moon must be operating in a I :I' _ 5. the graph below shows the demand for Cosmic shampoo. DJ 60 50 40 Costs and revenues 30 20 10 200 400 600 80 0800, 3500 1200 Quantity per period Suppose there are no fixed costs and marginal cost is a constant $30. a. What are the perfectly competitive price and output? Price: $ Output: b. What are the cartel (monopoly) price and output? Price: $ Output: I c. If there are only four firms in the cartel, what are the price and output of each firm, assuming equal shares? Round your answers to 1 decimal place. Price: $ Output:6. The graph shown below is that of Do Drop In, a shop in the dry-cleaning industry. 20 18 MC 16 AC 14 12 10 Cost and revenues (in dollars) M505 MR 60 120 180 240 300 360 420 Quantity per period a) At the optimal output, what price will Do Drop In charge and what will be its output? b) At the optimal price and output, what will be its total revenue, total cost, and total loss? TR: $ ; TC: $ I Total loss: 33' c) If this rm made a rational decision to continue to produce, despite the loss, average variable cost must be below what level? AVC must be less than $ I . PART 2 1. The graph given below depicts the market for metal kegs. Ps Costs and revenues PA Quantity per period a) Name the four curves shown in the graph: (1) (2) (3) (4) b) If this were a perfectly competitive market, what would be the equilibrium price and quantity? Price: Quantity: c) Suppose instead that the graph depicts a monopolist. What will be the profit-maximizing price and quantity? Price: Quantity: d) Now suppose that the government is not satisfied with the monopolist's performance and decides to impose a socially optimum price. What will be the new price and quantity? Price: Quantity: e) Finally, suppose that instead of the socially optimum price, the government imposes a fair-return price. What will be the price and quantity? Price:\f2. The graph below shows the demand and marginal cost curves for the monopolist Mr. Peanut. a. Draw the marginal revenue curve. Plot only the endpoints of the graph below. 33 Tools 30 / 27 24 21 18 15 12 9 6 3 marginal revei 0 30 60 90120150180210240270300330 Quantity per period b. What are the values of the profit-maximizing output and price? 0. What are the values of output, price and total revenue when the firm's total revenue is maximized? Total revenue: $ I 3. The graph below shows the cost and revenue curves for lchiBan Inc., a monopolist. 18 AC 15 12 f Revenues and costs 30 60 90 120 150 180 Quantity per period a. What is the monopolist's profit-maximizing output and price? b. What will be the monopolist's total profit? ' 4. Sol-Motors is the only auto manufacturer in West Lidia, a country that prohibits the importation of cars. The graph below shows the demand and the costs for Sol-Motors. [E] 66 Toms 60 g / 54 g MR 3 48 E E 42 23' 35 g 5 30 b E 24 13 E 13 0'] g 12 6 0 20 40 60 80100120140160180200220 Quantity per period (in thousands) a. Add the marginal revenue curve to the graph above (starting at zero). Plot only the end points. b. What are Sol-Motors\" profit-maximizing output and price? Output: I thousands Price: $ thousands 0. Suppose that the government of Lidia imposes a price ceiling of $30,000 per car. What is the firm's profit-maximizing output now? Profit-maximizing output: ' thousands d. What would be the output if the graph represented a perfectly competitive industry rather than a monopoly? Output: thousands 5. Graph shows the cost and revenue information for Shitotsu the monopolist. What are the levels of price, output, total (sales) revenue, and total profits if the monopolist were to produce at the positions (a) through (d) indicated in table below? 60 [MC] 54 m 48 42 36 30 24 18 \\ ' 12 6 12 18 24 30 36 42 Costs and revenues Quantity per period Total Total _ rice($)_0utputRevenue ($) Prots ($) a. Total revenue maximization\" I . I II I b. Profitmaximization I I . I II c. Socially optimum price I I . I II I d. Fairireturn price I _I _ I II I 6. a. Complete the table below, which shows the costs and revenues of Solo the monopolist. (You may assume that the demand curve is a straight line.) Leave no cells blank be certain to enter "0" wherever required. Quantity per Period Price TR MR MC TC 0 / / _ / / $7 1 I 1 $32 $ I $ I $8 79 2 I I I 7 86 3 28 If If 6 92 4 If I l 5 97 5 f 120 If 6 103 6 If If If 7 110 7 20 If If 8 118 8 I I 9 127 9 l I 10 137 10 I I 12 149 b. What are the values of the profit-maximizing output, price. and total profit or loss? Total I j' ; $ I c. At what output will total revenue be maximized, and what will be the value of total revenue? Output (units): Total revenue: $ I d. What is the value of MR when profits are maximized and when total revenue is maximized? MR is $ I when profits are maximized. MR is I when total revenue is maximized. 7. The following table shows the cost and revenue data for Molly the monopolist. Quantity per Period Price Total Revenue Marginal Revenue Marginal Cost Total Cost| 0 $31 I s / / $5 I 1 30 $ I $ I 30 I 2 29 I I 52 I w 28 70 27 83 26 105 6 25 128 7 24 152 8 23 177 22 204 a. Complete the table above. b. What are Molly's profit-maximizing output and price, and what will be the amount of her profit? Output: Price:$ Profit: $ c. Suppose that the demand for Molly's product increased by three units at every price level. Complete the table below. Quantity per Period Price Total Revenue Marginal Revenue Marginal Cost Total Cost $31 $ $ 30 $ 29 28 27 26 25 24 23 22 d. What will be her new profit-maximizing output and price, and what will be the amount of her profit? Output:Price: 33 Profit: $ ' 8. The following table gives the cost and demand data for a particular market. Output Price ($) Marginal Revenue Average Cost $ Marginal Cost $ 0 1 16 $16 $24 $10 2 14.5 13 15 6 3 13 10 11.7 5 4 11.5 7 10.5 7 5 10 4 10 8 6 8.5 1 9.75 8.5 7 7 -2 9.6 9 8 5.5 -5 9.6 9.3 9 4 -80 9.6 9.5 Refer to the above information to answer this question. Suppose that the data describes a monopoly industry. W'hat will be the monopoly price and output? Multiple Choice F $11.5 and 4. r' $10 and 5. r' $8.5 and 6. F $7 and 7. F $5.5 and 8. Refer to the above information to answer this question. Suppose that the data describes a monopoly industry. W'hat will be the total prots or loss at the profit-maximizing output? Multiple Choice 9 $0. F Profit of $3.5. F Profit of $4. F Profit of $4.5. F Loss of$9. Refer to the above information to answer this question. Suppose that the data describes a perfectly competitive industry. What will be the equilibrium price and output? Multiple Choice '" $11.5 and 4. r $10 and 5. r $8.5 and 6. P $7 and 7. F $5.5 and 8. Refer to the above information to answer this question. Suppose that the data describes a perfectly competitive industry. What will be the total prot or loss of the industry at equilibrium? Multiple Choice r" $0. 5 Profitof$3.5. 5 Profit of$4. r Profitof$4.5. 5 Loss of $7.50
Step by Step Solution
There are 3 Steps involved in it

Get step-by-step solutions from verified subject matter experts