

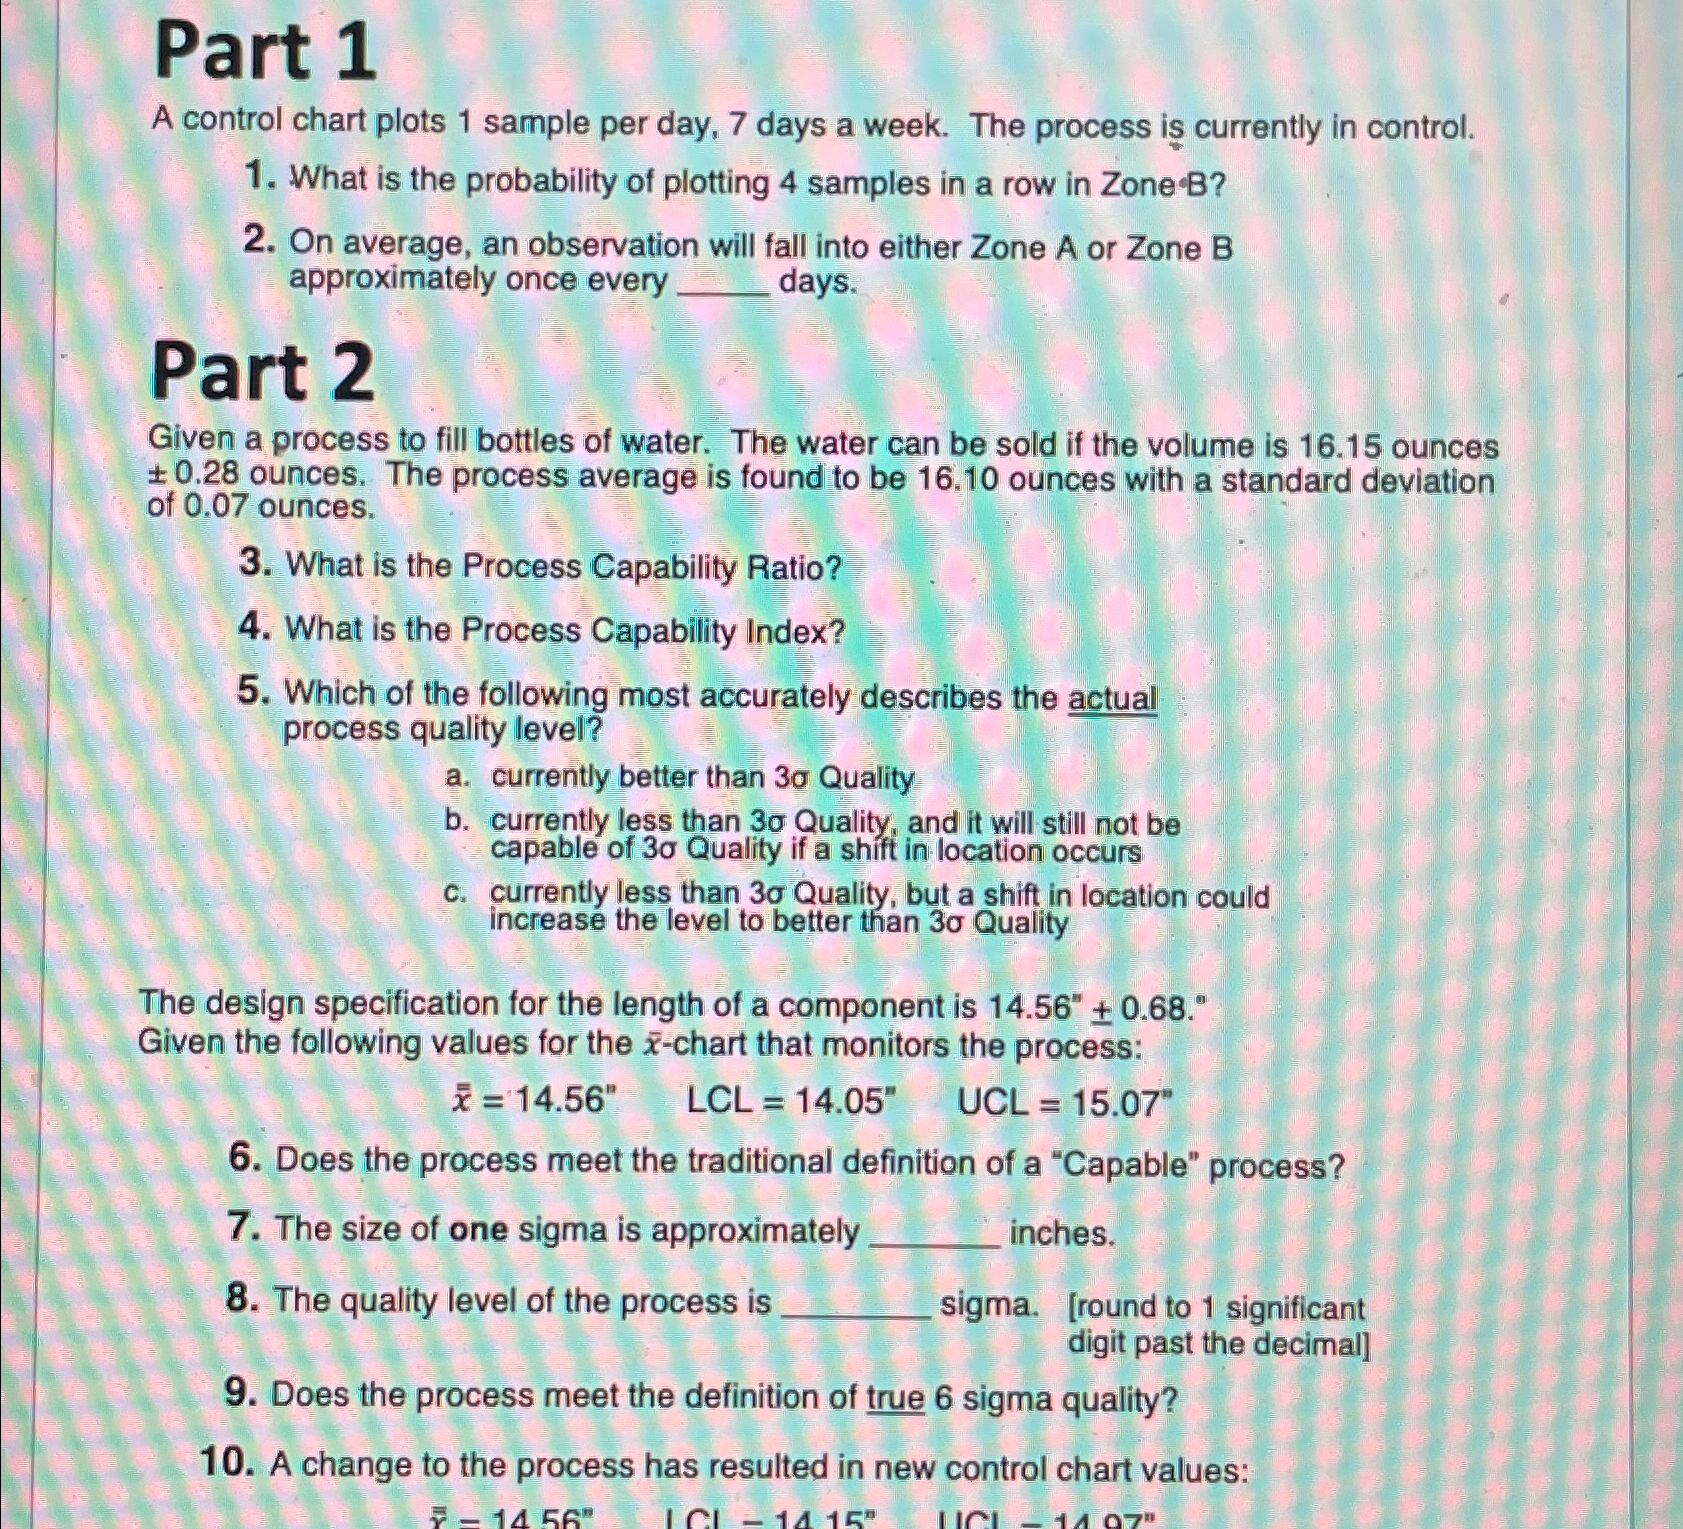
Question: Part 1 A control chart plots 1 sample per day, 7 days a week. The process is currently in control. What is the probability of
Part
A control chart plots sample per day, days a week. The process is currently in control.
What is the probability of plotting samples in a row in Zone
On average, an observation will fall into either Zone A or Zone B approximately once every days.
Part
Given a process to fill bottles of water. The water can be sold if the volume is ounces ounces. The process average is found to be ounces with a standard deviation of ounces.
What is the Process Capability Ratio?
What is the Process Capability Index?
Which of the following most accurately describes the actual process quality level?
a currently better than Quality
b currently less than Quality, and it will still not be capable of Quality if a shift in location occurs
c currently less than Quality, but a shift in location could increase the level to better than Quality
The design specification for the length of a component is
Given the following values for the chart that monitors the process:
UCL
Does the process meet the traditional definition of a "Capable" process?
The size of one sigma is approximately inches.
The quality level of the process is sigma. round to significant digit past the decimal
Does the process meet the definition of true sigma quality?
A change to the process has resulted in new control chart values:
Step by Step Solution
There are 3 Steps involved in it
1 Expert Approved Answer
Step: 1 Unlock

Question Has Been Solved by an Expert!
Get step-by-step solutions from verified subject matter experts
Step: 2 Unlock
Step: 3 Unlock