

Question: A control chart plots 38 samples per day, 7 days a week. The process runs 24 hours per day and the chart is currently in
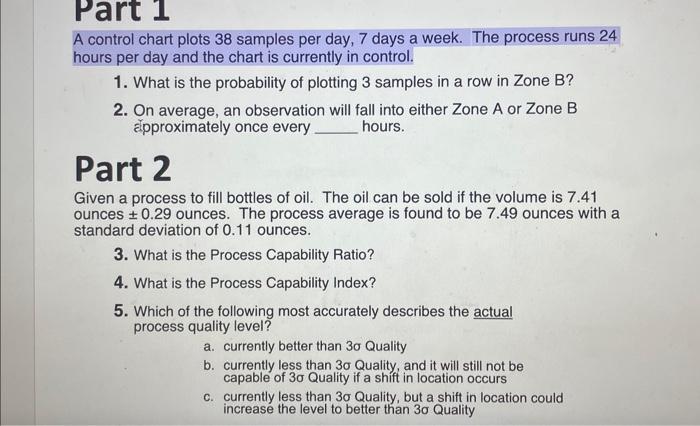
A control chart plots 38 samples per day, 7 days a week. The process runs 24 hours per day and the chart is currently in control. 1. What is the probability of plotting 3 samples in a row in Zone B? 2. On average, an observation will fall into either Zone A or Zone B Elpproximately once every hours. Part 2 Given a process to fill bottles of oil. The oil can be sold if the volume is 7.41 ounces \pm 0.29 ounces. The process average is found to be 7.49 ounces with a standard deviation of 0.11 ounces. 3. What is the Process Capability Ratio? 4. What is the Process Capability Index? 5. Which of the following most accurately describes the actual process quality level? a. currently better than 3 Quality b. currently less than 3 Quality, and it will still not be capable of 3 Quality if a shift in location occurs c. currently less than 3 Quality, but a shift in location could increase the level to better than 3 Quality
Step by Step Solution
There are 3 Steps involved in it

Get step-by-step solutions from verified subject matter experts