

Question: Part 1. Create a Bar chart schedule from the Precedence Network diagram shown below. Show the Early dates in fully highlighted boxes and the Late
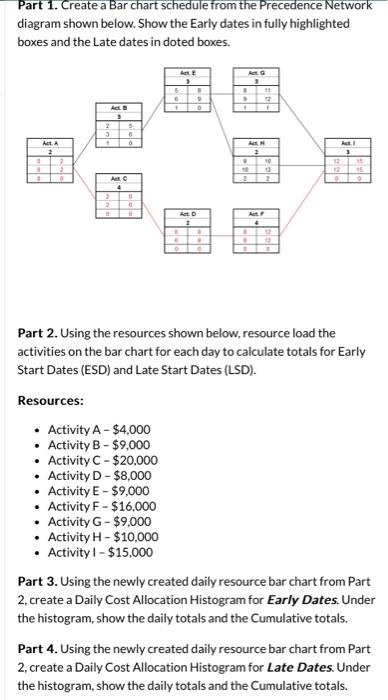
Part 1. Create a Bar chart schedule from the Precedence Network diagram shown below. Show the Early dates in fully highlighted boxes and the Late dates in doted boxes. Part 2. Using the resources shown below, resource load the activities on the bar chart for each day to calculate totals for Early Start Dates (ESD) and Late Start Dates (LSD). Resources: - Activity A - $4,000 - Activity B - $9,000 - Activity C - $20,000 - Activity D - $8,000 - Activity E$9,000 - Activity F- $16,000 - Activity G - $9,000 - Activity H$10,000 - Activity 1-\$15,000 Part 3. Using the newly created daily resource bar chart from Part 2, create a Daily Cost Allocation Histogram for Early Dates. Under the histogram, show the daily totals and the Cumulative totals. Part 4. Using the newly created daily resource bar chart from Part 2, create a Daily Cost Allocation Histogram for Late Dates. Under the histogram, show the daily totals and the Cumulative totals
Step by Step Solution
There are 3 Steps involved in it

Get step-by-step solutions from verified subject matter experts