

Question: PART 1 DATA SETList your data below in numerical order.The list of data for heights (in cm) of 20 students are : creating the data
PART 1 DATA SETList your data below in numerical order.The list of data for heights (in cm) of 20 students are : creating the data set in ascending numerical order:Note: listing a data set for the first 20 students in a classroom, i.e., from 1 - 20 students, (I am not arranging their heights in ascending order).STUDENT HEIGHT (in cm) student-1152student-2158student-3165student-4171student-5169student-6155student-7160student-8168student-9175student-10162student-11170student-12166student-13159student-14172student-15163student-16157student-17167student-18176student-19154student-20161Explain your data. What does each data point represent?Each data point represents the height of each student from 20 students in centimeters. For, example if we want student 7's height we can say from the dataset as his/her height is 160 centimeters.In the place of student 1, 2, .., we can also put their names in the data set.What is the mean of your data?For that, we need to sum up all the heights and divide by the total number of students.(In our case, we have 20 students).So, Mean = 164Then the mean of our data is 164 centimeters. (we may also get decimal numbers for different data sets).What is the minimum and maximum within your data?The minimum and maximum are the lowest or least and highest or greatest values respectively in our data set.i.e., The minimum height is 152 cm. (the height of student 1)The maximum height is 176 cm. (the height of student 18)
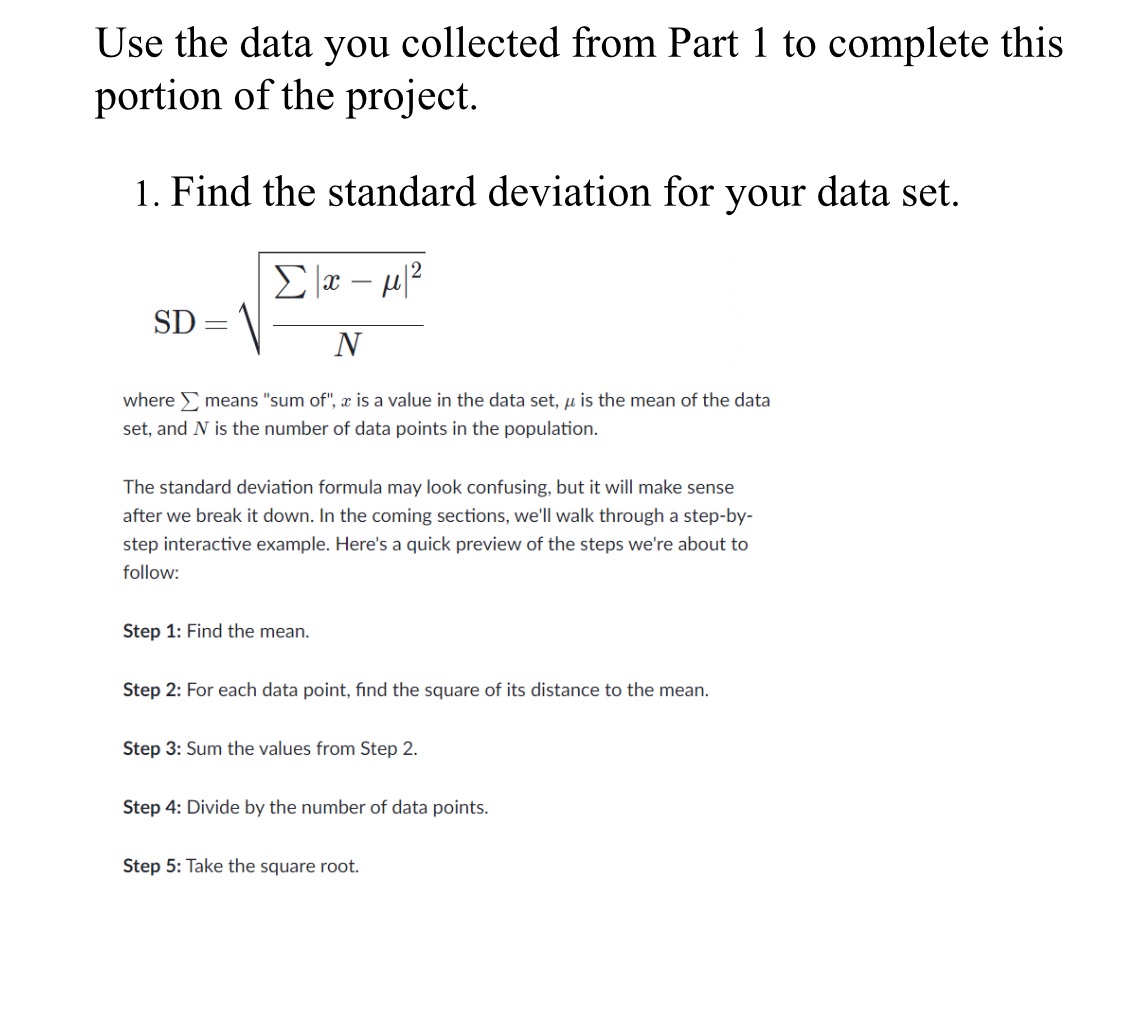
Use the data you collected from Part 1 to complete this portion of the project. 1. Find the standard deviation for your data set. > |z pf? N where Y means "sum of', z is a value in the data set, p is the mean of the data set, and NV is the number of data points in the population. The standard deviation formula may look confusing, but it will make sense after we break it down. In the coming sections, we'll walk through a step-by- step interactive example. Here's a quick preview of the steps we're about to follow: Step 1: Find the mean. Step 2: For each data point, find the square of its distance to the mean. Step 3: Sum the values from Step 2. Step 4: Divide by the number of data points. Step 5: Take the square root
Step by Step Solution
There are 3 Steps involved in it

Get step-by-step solutions from verified subject matter experts