

Question: Part 1: Fill out the table below with the correct values for the cost, revenue and profit using the equations below. Cost: C(x) =
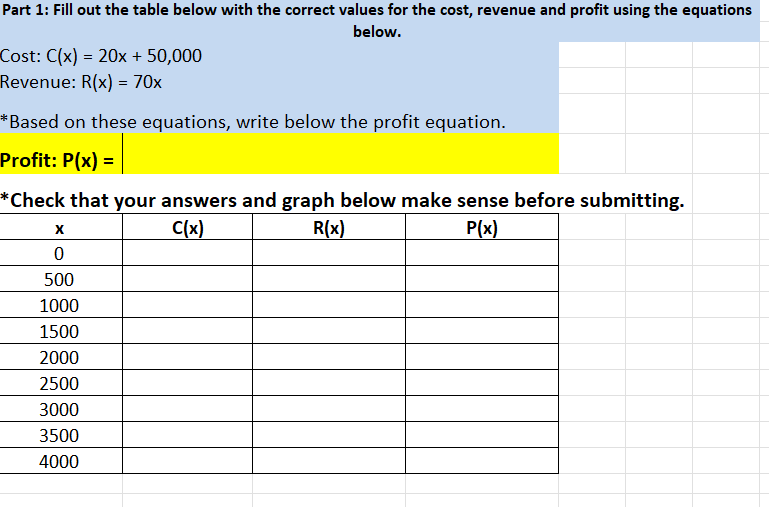
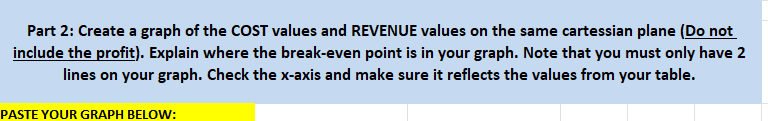
Part 1: Fill out the table below with the correct values for the cost, revenue and profit using the equations below. Cost: C(x) = 20x + 50,000 Revenue: R(x) = 70x *Based on these equations, write below the profit equation. Profit: P(x) = *Check that your answers and graph below make sense before submitting. x 0 500 1000 1500 2000 2500 3000 3500 4000 C(x) R(x) P(x) Part 2: Create a graph of the COST values and REVENUE values on the same cartessian plane (Do not include the profit). Explain where the break-even point is in your graph. Note that you must only have 2 lines on your graph. Check the x-axis and make sure it reflects the values from your table. PASTE YOUR GRAPH BELOW:
Step by Step Solution
There are 3 Steps involved in it

Get step-by-step solutions from verified subject matter experts