

Question: Part 1. FM Modulation message or modulating signal: m(t) = Amcos(2fmt) m=Am*cos(2*pi*fm*t), Matlab equation carrier: c(t) = Ac cos(2rfet), C=Ac*cos(2*pi*fc*t), Matlab equation modulation index: B
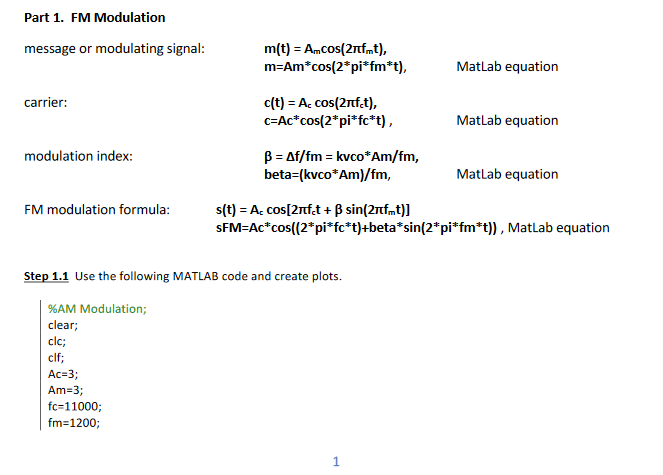
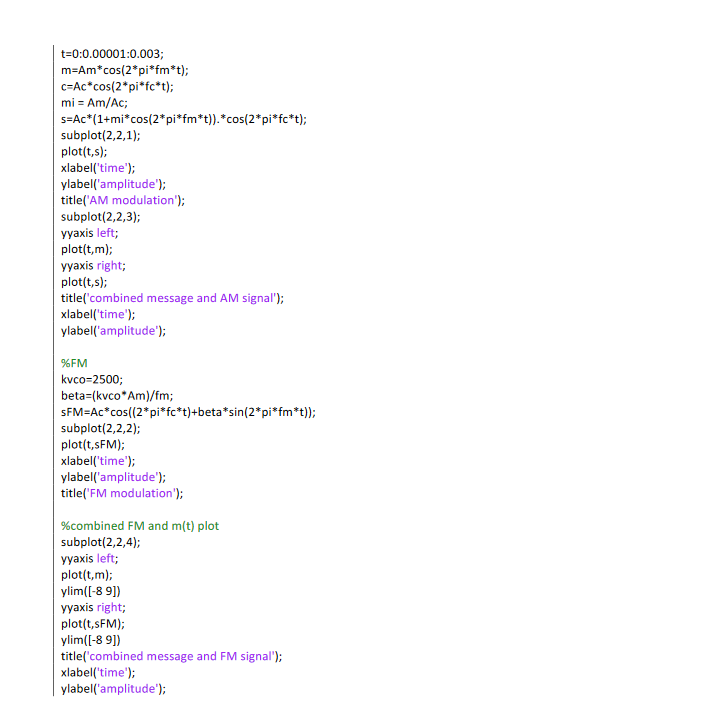
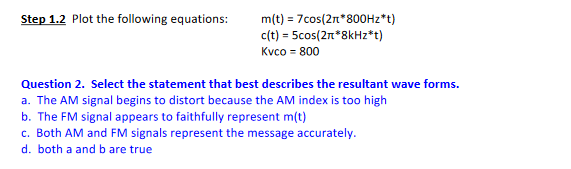
Part 1. FM Modulation message or modulating signal: m(t) = Amcos(2fmt) m=Am*cos(2*pi*fm*t), Matlab equation carrier: c(t) = Ac cos(2rfet), C=Ac*cos(2*pi*fc*t), Matlab equation modulation index: B = Af/fm = kvco*Am/fm, beta=(kvco*Am)/fm, Matlab equation s(t) = Ac cos[2nfet + sin(21fmt)] SFM=Ac*cos((2*pi*fc*t)+beta*sin(2*pi*fm*t)), Matlab equation FM modulation formula: Step 1.1 Use the following MATLAB code and create plots. %AM Modulation; clear; clc; clf; Ac=3; Am=3; fc=11000; fm=1200; 1 t=0:0.00001:0.003; m=Am*cos(2*pi*fm*t); C=Ac*cos(2*pi*fc*t); mi = Am/Ac; s=Ac*(1+mi* cos(2*pi*fm*t)).*cos(2*pi*fc*t); subplot(2,2,1); plot(t,s); xlabel("time"); ylabel('amplitude"); title('AM modulation'); subplot(2,2,3); yyaxis left; plot(t,m); yyaxis right; plot(t,s); title('combined message and AM signal"); xlabel('time'); ylabel('amplitude'); %FM kvco=2500; beta=(kvco*Am)/fm; SFM=Ac*cos((2*pi*fc*t)+beta* sin(2*pi*fm*t)); subplot(2,2,2); plot(t,sFM); xlabel('time'); ylabel'amplitude'); title('FM modulation'); %combined FM and m(t) plot subplot(2,2,4); yyaxis left; plot(t,m); ylim([-8 9)) yyaxis right; plot(t,sFM); ylim([-8 9)) title('combined message and FM signal"); xlabel("time"); ylabel('amplitude"); Step 1.2 Plot the following equations: m(t) = 7cos(21*800Hz*t) c(t) = 5cos(27*8kHz*t) Kvco = 800 Question 2. Select the statement that best describes the resultant wave forms. a. The AM signal begins to distort because the AM index is too high b. The FM signal appears to faithfully represent m(t) C. Both AM and FM signals represent the message accurately. d. both a and b are true Part 1. FM Modulation message or modulating signal: m(t) = Amcos(2fmt) m=Am*cos(2*pi*fm*t), Matlab equation carrier: c(t) = Ac cos(2rfet), C=Ac*cos(2*pi*fc*t), Matlab equation modulation index: B = Af/fm = kvco*Am/fm, beta=(kvco*Am)/fm, Matlab equation s(t) = Ac cos[2nfet + sin(21fmt)] SFM=Ac*cos((2*pi*fc*t)+beta*sin(2*pi*fm*t)), Matlab equation FM modulation formula: Step 1.1 Use the following MATLAB code and create plots. %AM Modulation; clear; clc; clf; Ac=3; Am=3; fc=11000; fm=1200; 1 t=0:0.00001:0.003; m=Am*cos(2*pi*fm*t); C=Ac*cos(2*pi*fc*t); mi = Am/Ac; s=Ac*(1+mi* cos(2*pi*fm*t)).*cos(2*pi*fc*t); subplot(2,2,1); plot(t,s); xlabel("time"); ylabel('amplitude"); title('AM modulation'); subplot(2,2,3); yyaxis left; plot(t,m); yyaxis right; plot(t,s); title('combined message and AM signal"); xlabel('time'); ylabel('amplitude'); %FM kvco=2500; beta=(kvco*Am)/fm; SFM=Ac*cos((2*pi*fc*t)+beta* sin(2*pi*fm*t)); subplot(2,2,2); plot(t,sFM); xlabel('time'); ylabel'amplitude'); title('FM modulation'); %combined FM and m(t) plot subplot(2,2,4); yyaxis left; plot(t,m); ylim([-8 9)) yyaxis right; plot(t,sFM); ylim([-8 9)) title('combined message and FM signal"); xlabel("time"); ylabel('amplitude"); Step 1.2 Plot the following equations: m(t) = 7cos(21*800Hz*t) c(t) = 5cos(27*8kHz*t) Kvco = 800 Question 2. Select the statement that best describes the resultant wave forms. a. The AM signal begins to distort because the AM index is too high b. The FM signal appears to faithfully represent m(t) C. Both AM and FM signals represent the message accurately. d. both a and b are true
Step by Step Solution
There are 3 Steps involved in it

Get step-by-step solutions from verified subject matter experts