

Question: Part 1 **Please use R studio to answer the following questions and please provide the R script. Thanks** Set up a simulated dataset to explore:
Part 1
**Please use R studio to answer the following questions and please provide the R script. Thanks**
Set up a simulated dataset to explore: A) how sample size influences coefficient precision
Set up a simulated dataset with the following characteristics:
- N = 100,000
- X1 = random_uniform
- X2 = random_uniform
- X3 = 0.2*X1 + random_normal(mean=1, sd=.2)
- Y = 0.2*X1 + 0.2*log(X2) + 0.1*X3 + random_normal(mean=1, sd=.2)
Perform and report on the following analysis:
- Draw random samples of varying sizes (N=50,100,200,1000, etc.) and run regression models
- What happens to estimate precision across models? Why?
*** The following screenshots are the sample codes, please use them as reference/help***
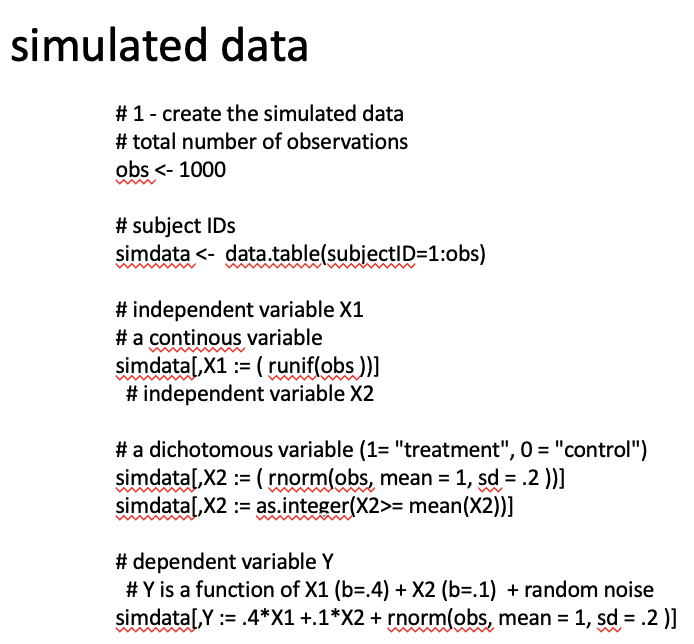
simulated data # 1 - create the simulated data # total number of observations obs = mean(X2))] # dependent variable Y # Y is a function of X1 (b=.4) + X2 (b=.1) + random noise simdata[,Y := .4*X1 +.1*X2 + rnorm(obs, mean = 1, sd = .2 )] w
Step by Step Solution
There are 3 Steps involved in it
1 Expert Approved Answer
Step: 1 Unlock

Question Has Been Solved by an Expert!
Get step-by-step solutions from verified subject matter experts
Step: 2 Unlock
Step: 3 Unlock