Question: Part 1 Simple Computation for PE Multiples Announcing Date 4/17/2019 7/9/2019 10/3/2019 2/13/2020 4/28/2020 7/13/2020 10/1/2020 Fiscal Period Reported EPS (Actual) Stock Price (Quarter-End) T12M
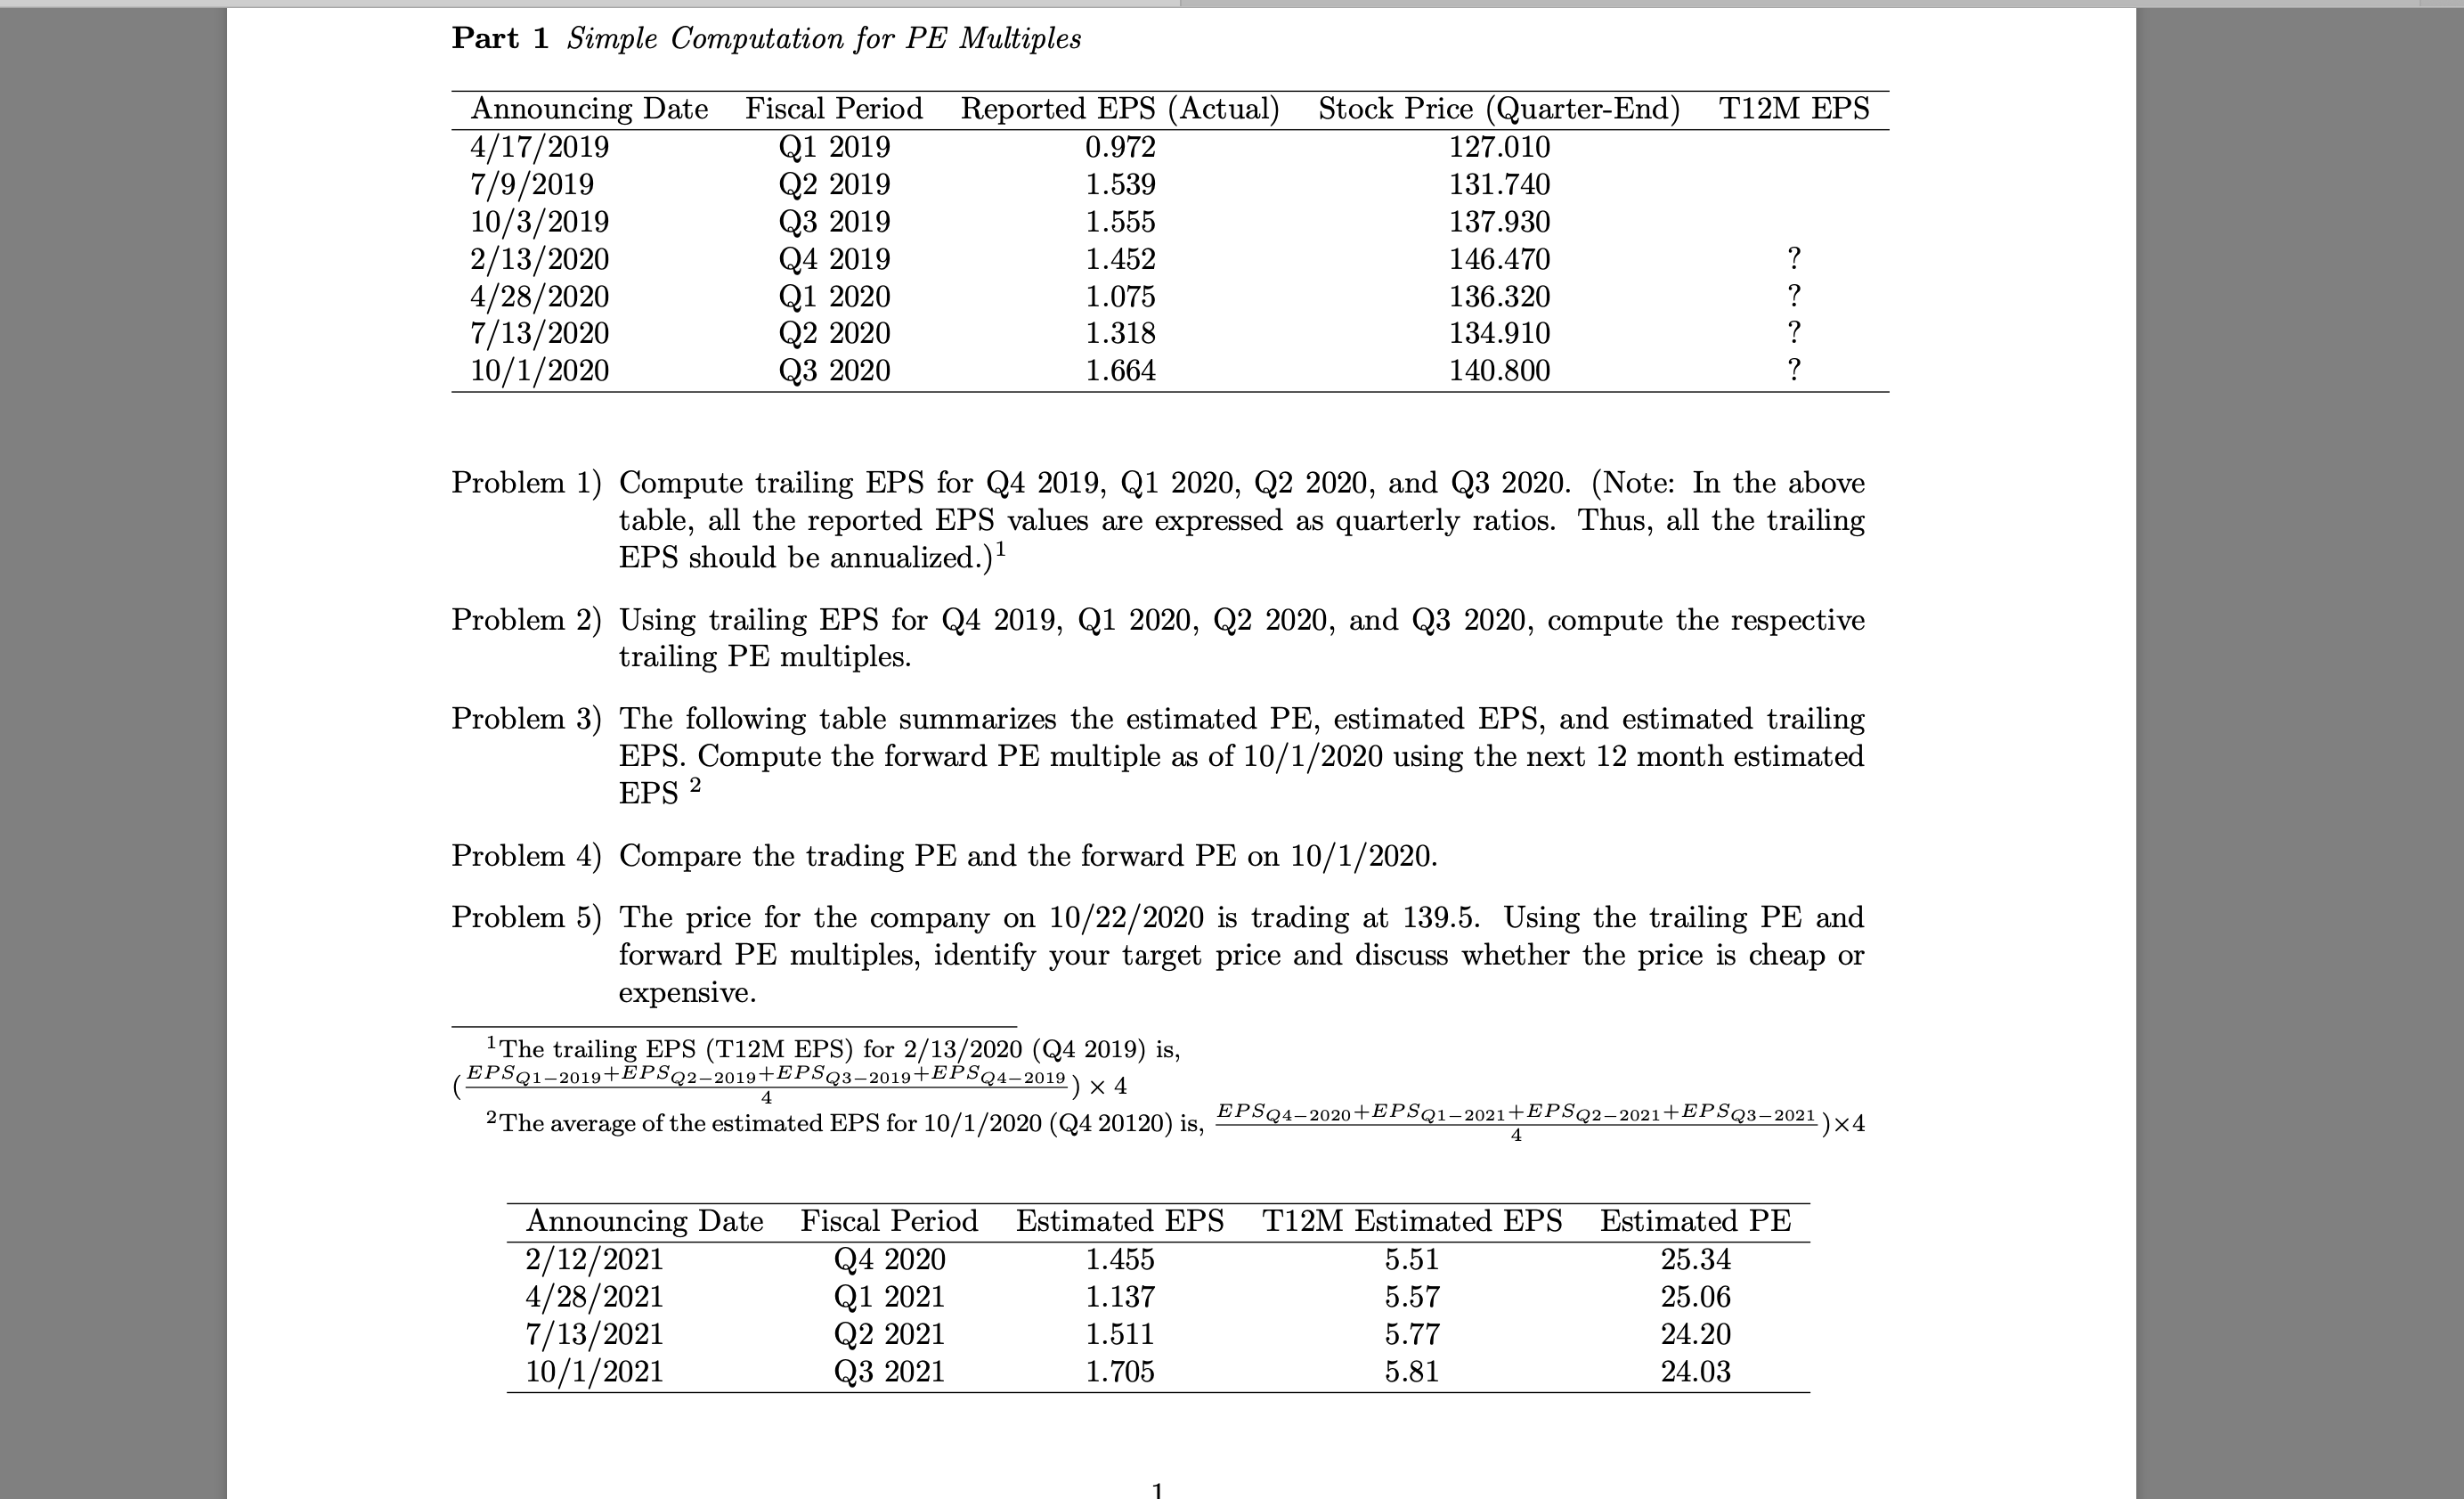
Part 1 Simple Computation for PE Multiples Announcing Date 4/17/2019 7/9/2019 10/3/2019 2/13/2020 4/28/2020 7/13/2020 10/1/2020 Fiscal Period Reported EPS (Actual) Stock Price (Quarter-End) T12M EPS Q1 2019 0.972 127.010 Q2 2019 1.539 131.740 Q3 2019 1.555 137.930 Q4 2019 1.452 146.470 ? Q1 2020 1.075 136.320 ? Q2 2020 1.318 134.910 ? Q3 2020 1.664 140.800 ? Problem 1) Compute trailing EPS for Q4 2019, Q1 2020, Q2 2020, and Q3 2020. (Note: In the above table, all the reported EPS values are expressed as quarterly ratios. Thus, all the trailing EPS should be annualized.)1 Problem 2) Using trailing EPS for Q4 2019, Q1 2020, Q2 2020, and Q3 2020, compute the respective trailing PE multiples. Problem 3) The following table summarizes the estimated PE, estimated EPS, and estimated trailing EPS. Compute the forward PE multiple as of 10/1/2020 using the next 12 month estimated EPS 2 Problem 4) Compare the trading PE and the forward PE on 10/1/2020. Problem 5) The price for the company on 10/22/2020 is trading at 139.5. Using the trailing PE and forward PE multiples, identify your target price and discuss whether the price is cheap or expensive. 1 The trailing EPS (T12M EPS) for 2/13/2020 (Q4 2019) is, EPSQ12019+PS222019+EPSQ32019+EPSQ42019) * 4 2The average of the estimated EPS for 10/1/2020 (Q4 20120) is, EPSQ42020+EPSQ12021 + EPSQ22021+EPSQ32021 )x4 4 Announcing Date 2/12/2021 4/28/2021 7/13/2021 10/1/2021 Fiscal Period Q4 2020 Q1 2021 Q2 2021 Q3 2021 Estimated EPS T12M Estimated EPS Estimated PE 1.455 5.51 25.34 1.137 5.57 25.06 1.511 5.77 24.20 1.705 5.81 24.03 1 Part 1 Simple Computation for PE Multiples Announcing Date 4/17/2019 7/9/2019 10/3/2019 2/13/2020 4/28/2020 7/13/2020 10/1/2020 Fiscal Period Reported EPS (Actual) Stock Price (Quarter-End) T12M EPS Q1 2019 0.972 127.010 Q2 2019 1.539 131.740 Q3 2019 1.555 137.930 Q4 2019 1.452 146.470 ? Q1 2020 1.075 136.320 ? Q2 2020 1.318 134.910 ? Q3 2020 1.664 140.800 ? Problem 1) Compute trailing EPS for Q4 2019, Q1 2020, Q2 2020, and Q3 2020. (Note: In the above table, all the reported EPS values are expressed as quarterly ratios. Thus, all the trailing EPS should be annualized.)1 Problem 2) Using trailing EPS for Q4 2019, Q1 2020, Q2 2020, and Q3 2020, compute the respective trailing PE multiples. Problem 3) The following table summarizes the estimated PE, estimated EPS, and estimated trailing EPS. Compute the forward PE multiple as of 10/1/2020 using the next 12 month estimated EPS 2 Problem 4) Compare the trading PE and the forward PE on 10/1/2020. Problem 5) The price for the company on 10/22/2020 is trading at 139.5. Using the trailing PE and forward PE multiples, identify your target price and discuss whether the price is cheap or expensive. 1 The trailing EPS (T12M EPS) for 2/13/2020 (Q4 2019) is, EPSQ12019+PS222019+EPSQ32019+EPSQ42019) * 4 2The average of the estimated EPS for 10/1/2020 (Q4 20120) is, EPSQ42020+EPSQ12021 + EPSQ22021+EPSQ32021 )x4 4 Announcing Date 2/12/2021 4/28/2021 7/13/2021 10/1/2021 Fiscal Period Q4 2020 Q1 2021 Q2 2021 Q3 2021 Estimated EPS T12M Estimated EPS Estimated PE 1.455 5.51 25.34 1.137 5.57 25.06 1.511 5.77 24.20 1.705 5.81 24.03 1


