

You'll need to collect range data by measuring the horizontal distance the ball lands from the launch
Question:
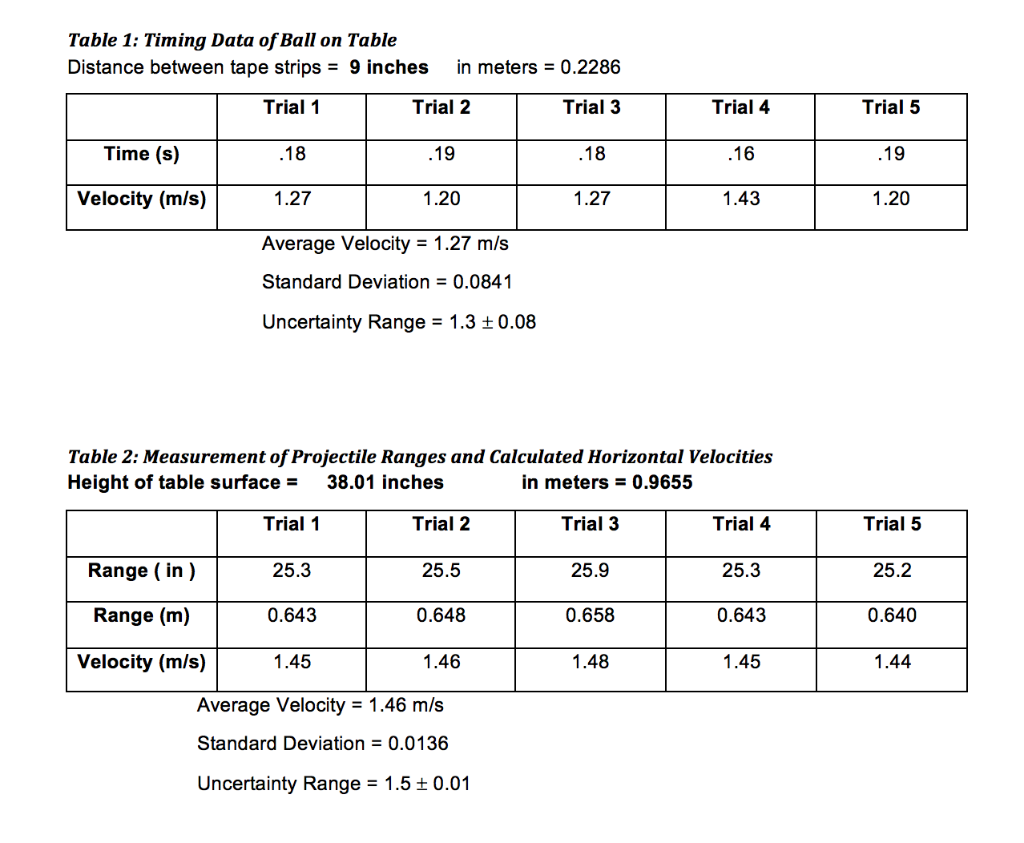
You'll need to collect range data by measuring the horizontal distance the ball lands from the launch line marked on the floor, as indicated by R in the figure above. If you can't launch the ball (again from the same ramp height) and closely watch where the ball lands on the floor by yourself, then enlist in an assistant that can perform one of these operations. Once the spot the ball lands is determined, measure the distance from it to the starting line on the floor using a ruler or tape measure. Estimate your distances to either tenths of an inch or millimeters depending on the tool you are using. Tenths of an inch will be easier to convert to meters later. Place this measurement in Table 2 using the appropriate units as collected, then place the equivalent range value converted to meters. Repeat for at least a total of 5 measurements. Also be sure to measure the height of your table above the floor, again using a tape measure, carpenters square or level, or sewing tape, and record in Table 2. Use as much precision as you can.
PART 2:
***Again this is just to explain the experiment, not the actual question***
Next we are going to measure the horizontal range of the projectile for different velocity values. There are two ways the velocities may be made to vary, by either adjusting the height of the ramp, or by adjusting the location of the tape strip on the ramp. As in part 1, you can measure the timing of the ball on the table and the range distance on the floor separately or simultaneously. Starting with a slow speed, collect 3 sets of times and 3 sets of ranges for each speed, and record in Table 3. Then repeat for a total of 5 different speeds recorded in each column in Table 3. 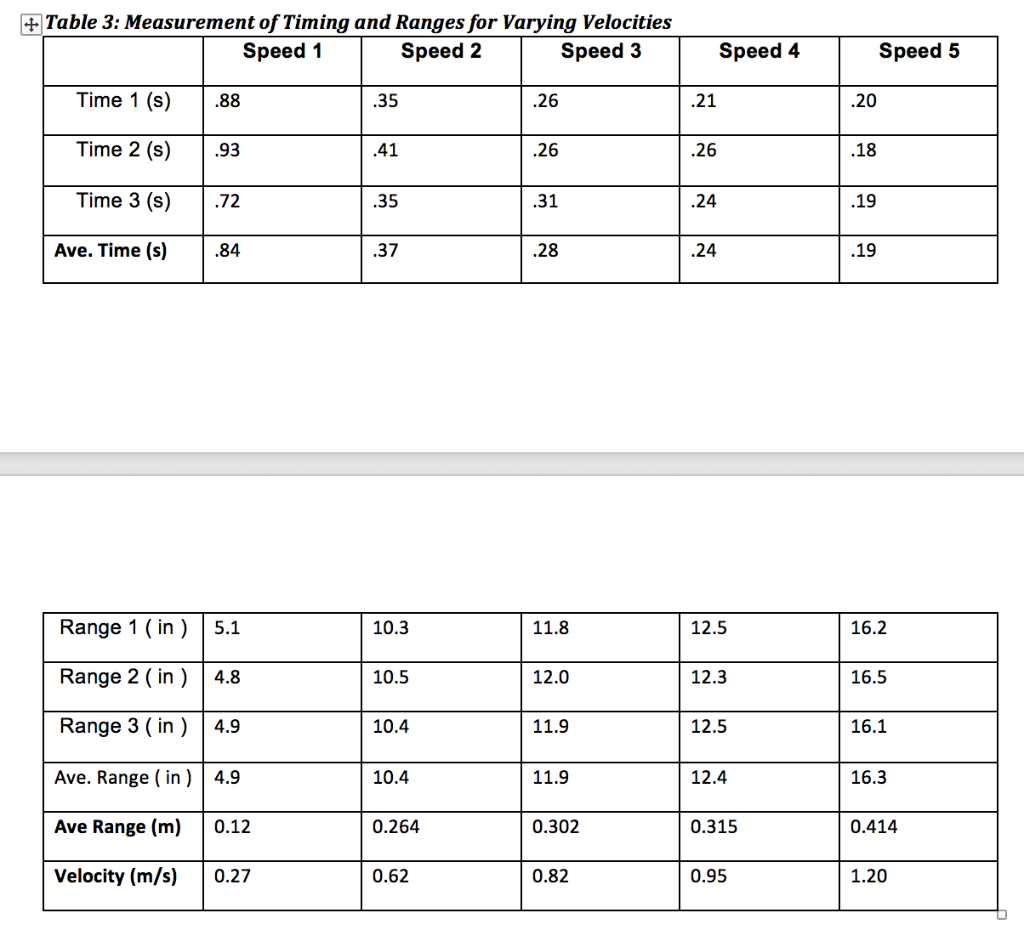
***This is the actual question***
In this section of your report, you'll want to offer a narrative on the precision of the computed velocity values from tables 1 and 2 by using the uncertainty ranges already computed. The precision gives you an indication of the level of random errors involved. Compute the percent difference between the average velocities found from both methods from Part 1., to indicate an accuracy level. Finally report on the level of precision from Part 2, simply by judging the spread of the timing and range data for each speed value. Are they comparable to the spread in Part 1?
Expert Answer:


Marketing Research
ISBN: 978-1118156636
11th edition
Authors: David A. Aaker, V. Kumar, Robert Leone, George S. Day
