

Question: Part 1. Utilize Table 1 and Table 2 to answer the Part 1 questions. 1. Illuminations consultants have prepared a list of financial ratios (numbers)
Part 1. Utilize Table 1 and Table 2 to answer the Part 1 questions.
1. Illuminations consultants have prepared a list of financial ratios (numbers) for your analyses. For each of the ratios (numbers), first identify which of the following category each ratio (number) falls under: A) Liquidity, B) Solvency, C) Profitability, or D) Efficiency. Then use the formula given below and calculate these ratios from 2006 to 2018 in Microsoft Excel. Make sure to use the cell referencing feature in Excel.
Administration Expense Ratio
Current Ratio
Debt to Asset Ratio
Debt to Net Asset Ratio
Defensive Interval
Liquid Funds Amount
Liquid Funds Indicator
Program Service Ratio
Quick Ratio
Return on Investment
Savings Indicator
Times Interest Earned Ratio
2. Explain the financial position and performance of the conservatory using the ratios that you have calculated in Part 1.1.
3. A graph is worth thousands of words. Use graphs to show the trends of financial performance of the conservatory. Do you derive the same conclusions as those from Part 1.2.?
4. Table 3 details ratios for peer art organizations. How does the Walden Conservatory of Music compare with its peers?
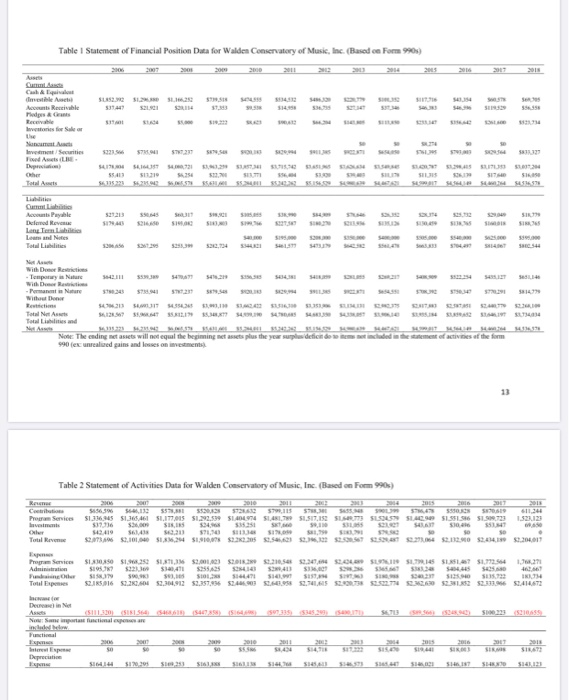
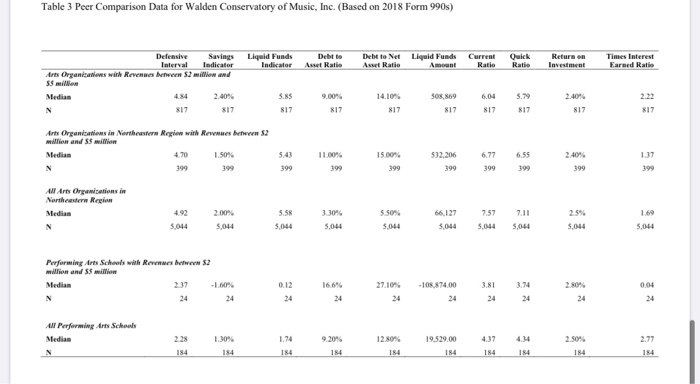

Table 1 Statement of Financial Position Duta for Walden Conservatory of Music, Inc. (Based on Form 990s) 17 S ETAS 144 41 2111 55113 S110AESTI 1304 SETSS15 S 521213 421317 335 42 51 1 3 2 Total Lists and 115707 Note: The ending met assets will not equal the beginning met assets plus the yowles det 990 eurd gain and soments som det oft e 41 of the form Table 2 Statement of Activities Data for Walden Conservatory of Music, Inc. (Based on Form 990s) SI 31665 SI 10561.17315 S25 S S14, SSIT 159 S SLES S 6 S19731 * 419 41 41 42 43 44 2036 2.101.040 13, 24 1,000 45 44 43 44 $2233 2 499 49 2 2 2 ST S Hai T 66 $2.132.0 52.34.10 $9.2001 SI3050 1035251.810,1 $2,001,23 2 2 105453,, SOLS 510517532300471 352 341351. 6 lus SISINS 1918 SOS SI SISSE Toul Expenses $2.506 52.20.0 53.304913 53.357.96 $24.903 . 95 9.741.65 27 S 15 SUS $1,722554 .271 58832 6 SISSE 0 533 53.33.65. 4473 P Naa arimalar 3170.1995 $16. 50 51 51355 5 5 5 5 514123 Table 3 Peer Comparison Data for Walden Conservatory of Music, Inc. (Based on 2018 Form 990s) Defensive Savings Interval Indicator v iew 52 willow and Liquid Funds Indicator Debt to Asset Ratio be to Net Aut Ratio Liquid Funds Amount Current Ratio Quick Ratio Return on Investment Times Interest Earned Ratio Arts Organisations with Re SS mille Media 484 5.85 14.10% .40% 2.40% 817 9.00% 817 508,8696.04 817 817 5.792 817 817 817 817 817 nes buven 2 Arts Organizations in Northern Regrew with million and S ilver Medias 4.70 399 5:43 11.00% 15.00% 2.40% 1.50% 399 532,206 399 6.776.55 399 399 399 399 Ars Orgwo ns in Northeastern Region Medias 4.922.00% 5,044 5,044 5.58 5.044 3.30% 5,044 5.50% 5.044 66,127 5,044 7.57 ,044 711 5,044 25% 5,044 Performing Arts Schools with Revmes between S2 million and million Medias 237 -1.60% 0.12 16.6% 27.10% 108,874,00 3.81 3.74 2.80% All Performing Arts Schools Median 228 1.30% 1.74 9.20% - 14 12.50% 14 19,529.00 15 4.37 14 4.34 13 : Table 1 Statement of Financial Position Duta for Walden Conservatory of Music, Inc. (Based on Form 990s) 17 S ETAS 144 41 2111 55113 S110AESTI 1304 SETSS15 S 521213 421317 335 42 51 1 3 2 Total Lists and 115707 Note: The ending met assets will not equal the beginning met assets plus the yowles det 990 eurd gain and soments som det oft e 41 of the form Table 2 Statement of Activities Data for Walden Conservatory of Music, Inc. (Based on Form 990s) SI 31665 SI 10561.17315 S25 S S14, SSIT 159 S SLES S 6 S19731 * 419 41 41 42 43 44 2036 2.101.040 13, 24 1,000 45 44 43 44 $2233 2 499 49 2 2 2 ST S Hai T 66 $2.132.0 52.34.10 $9.2001 SI3050 1035251.810,1 $2,001,23 2 2 105453,, SOLS 510517532300471 352 341351. 6 lus SISINS 1918 SOS SI SISSE Toul Expenses $2.506 52.20.0 53.304913 53.357.96 $24.903 . 95 9.741.65 27 S 15 SUS $1,722554 .271 58832 6 SISSE 0 533 53.33.65. 4473 P Naa arimalar 3170.1995 $16. 50 51 51355 5 5 5 5 514123 Table 1 Statement of Financial Position Duta for Walden Conservatory of Music, Inc. (Based on Form 990s) 17 S ETAS 144 41 2111 55113 S110AESTI 1304 SETSS15 S 521213 421317 335 42 51 1 3 2 Total Lists and 115707 Note: The ending met assets will not equal the beginning met assets plus the yowles det 990 eurd gain and soments som det oft e 41 of the form Table 2 Statement of Activities Data for Walden Conservatory of Music, Inc. (Based on Form 990s) SI 31665 SI 10561.17315 S25 S S14, SSIT 159 S SLES S 6 S19731 * 419 41 41 42 43 44 2036 2.101.040 13, 24 1,000 45 44 43 44 $2233 2 499 49 2 2 2 ST S Hai T 66 $2.132.0 52.34.10 $9.2001 SI3050 1035251.810,1 $2,001,23 2 2 105453,, SOLS 510517532300471 352 341351. 6 lus SISINS 1918 SOS SI SISSE Toul Expenses $2.506 52.20.0 53.304913 53.357.96 $24.903 . 95 9.741.65 27 S 15 SUS $1,722554 .271 58832 6 SISSE 0 533 53.33.65. 4473 P Naa arimalar 3170.1995 $16. 50 51 51355 5 5 5 5 514123 Table 3 Peer Comparison Data for Walden Conservatory of Music, Inc. (Based on 2018 Form 990s) Defensive Savings Interval Indicator v iew 52 willow and Liquid Funds Indicator Debt to Asset Ratio be to Net Aut Ratio Liquid Funds Amount Current Ratio Quick Ratio Return on Investment Times Interest Earned Ratio Arts Organisations with Re SS mille Media 484 5.85 14.10% .40% 2.40% 817 9.00% 817 508,8696.04 817 817 5.792 817 817 817 817 817 nes buven 2 Arts Organizations in Northern Regrew with million and S ilver Medias 4.70 399 5:43 11.00% 15.00% 2.40% 1.50% 399 532,206 399 6.776.55 399 399 399 399 Ars Orgwo ns in Northeastern Region Medias 4.922.00% 5,044 5,044 5.58 5.044 3.30% 5,044 5.50% 5.044 66,127 5,044 7.57 ,044 711 5,044 25% 5,044 Performing Arts Schools with Revmes between S2 million and million Medias 237 -1.60% 0.12 16.6% 27.10% 108,874,00 3.81 3.74 2.80% All Performing Arts Schools Median 228 1.30% 1.74 9.20% - 14 12.50% 14 19,529.00 15 4.37 14 4.34 13 : Table 1 Statement of Financial Position Duta for Walden Conservatory of Music, Inc. (Based on Form 990s) 17 S ETAS 144 41 2111 55113 S110AESTI 1304 SETSS15 S 521213 421317 335 42 51 1 3 2 Total Lists and 115707 Note: The ending met assets will not equal the beginning met assets plus the yowles det 990 eurd gain and soments som det oft e 41 of the form Table 2 Statement of Activities Data for Walden Conservatory of Music, Inc. (Based on Form 990s) SI 31665 SI 10561.17315 S25 S S14, SSIT 159 S SLES S 6 S19731 * 419 41 41 42 43 44 2036 2.101.040 13, 24 1,000 45 44 43 44 $2233 2 499 49 2 2 2 ST S Hai T 66 $2.132.0 52.34.10 $9.2001 SI3050 1035251.810,1 $2,001,23 2 2 105453,, SOLS 510517532300471 352 341351. 6 lus SISINS 1918 SOS SI SISSE Toul Expenses $2.506 52.20.0 53.304913 53.357.96 $24.903 . 95 9.741.65 27 S 15 SUS $1,722554 .271 58832 6 SISSE 0 533 53.33.65. 4473 P Naa arimalar 3170.1995 $16. 50 51 51355 5 5 5 5 514123
Step by Step Solution
There are 3 Steps involved in it

Get step-by-step solutions from verified subject matter experts