

Question: Part 2: 1. Roll five dice and find the mean of the numbers that you get. Repeat the experiment five times. You should have
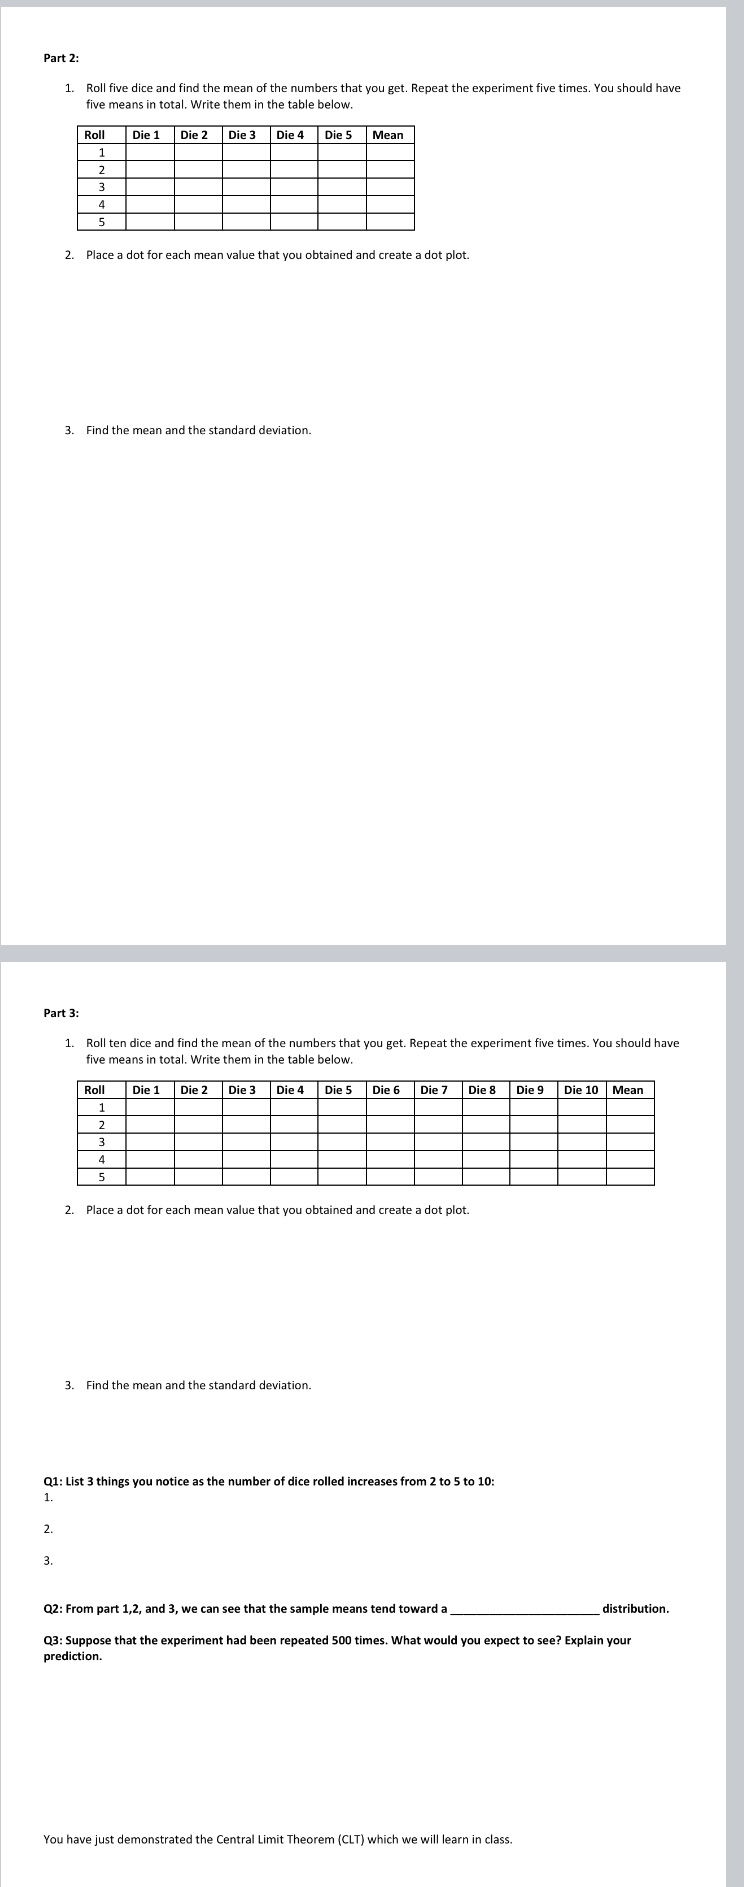
Part 2: 1. Roll five dice and find the mean of the numbers that you get. Repeat the experiment five times. You should have five means in total. Write them in the table below. Roll Die 1 Die 2 Die 3 Die 4 Die 5 Mean 1 2 3 4 5 2. Place a dot for each mean value that you obtained and create a dot plot. 3. Find the mean and the standard deviation. Part 3: 1. Roll ten dice and find the mean of the numbers that you get. Repeat the experiment five times. You should have five means in total. Write them in the table below. Roll Die 1 Die 2 Die 3 Die 4 Die 5 Die 6 Die 7 Die 8 Die 9 Die 10 Mean 1 2 3 4 5 2. Place a dot for each mean value that you obtained and create a dot plot. 3. Find the mean and the standard deviation. Q1: List 3 things you notice as the number of dice rolled increases from 2 to 5 to 10: 1. 2. 3. Q2: From part 1,2, and 3, we can see that the sample means tend toward a distribution. Q3: Suppose that the experiment had been repeated 500 times. What would you expect to see? Explain your prediction. You have just demonstrated the Central Limit Theorem (CLT) which we will learn in class.
Step by Step Solution
There are 3 Steps involved in it

Get step-by-step solutions from verified subject matter experts