Question: Part 2. (18 Points) In this section, use the script, One Variable. Display and Summary Stats.Q and the ST314 student survey dataset, f20-st314-student-survey.csv to explore
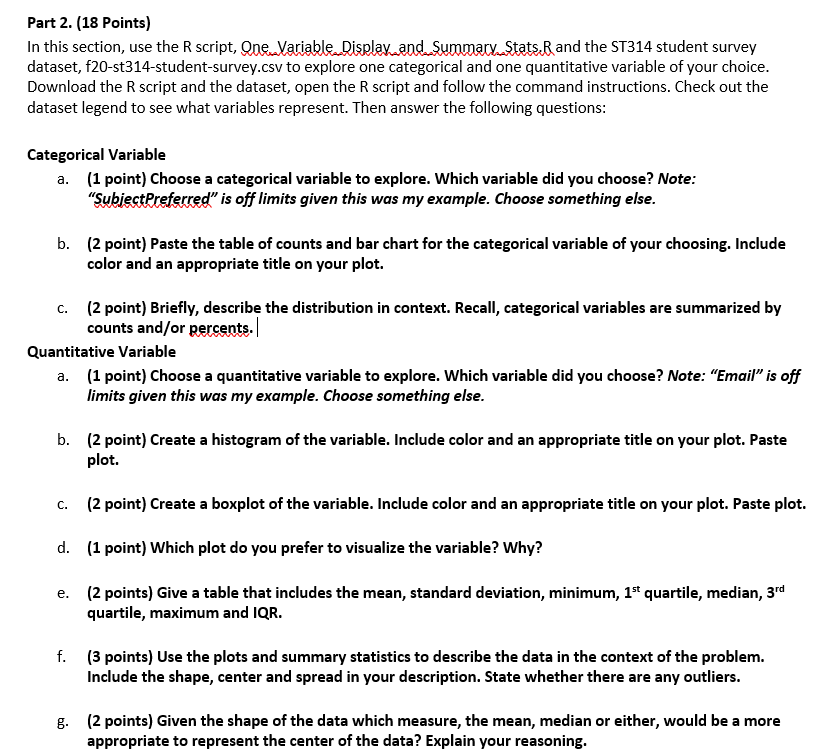
Part 2. (18 Points) In this section, use the script, One Variable. Display and Summary Stats.Q and the ST314 student survey dataset, f20-st314-student-survey.csv to explore one categorical and one quantitative variable of your choice. Download the script and the dataset, open the script and follow the command instructions. Check out the dataset legend to see what variables represent. Then answer the following questions: Categorical Variable a. (1 point) Choose a categorical variable to explore. Which variable did you choose? Note: "SubiectPreferred" is off limits given this was my example. Choose something else. b. (2 point) Paste the table of counts and bar chart for the categorical variable of your choosing. Include color and an appropriate title on your plot. C. (2 point) Briefly, describe the distribution in context. Recall, categorical variables are summarized by counts and/or percents. | Quantitative Variable a. (1 point) Choose a quantitative variable to explore. Which variable did you choose? Note: "Email" is off limits given this was my example. Choose something else. b. (2 point) Create a histogram of the variable. Include color and an appropriate title on your plot. Paste plot. C. (2 point) Create a boxplot of the variable. Include color and an appropriate title on your plot. Paste plot. d. (1 point) Which plot do you prefer to visualize the variable? Why? e. (2 points) Give a table that includes the mean, standard deviation, minimum, 15 quartile, median, 3rd quartile, maximum and IQR. f. (3 points) Use the plots and summary statistics to describe the data in the context of the problem. Include the shape, center and spread in your description. State whether there are any outliers. 8. (2 points) Given the shape of the data which measure, the mean, median or either, would be a more appropriate to represent the center of the data? Explain your reasoning. Part 2. (18 Points) In this section, use the script, One Variable. Display and Summary Stats.Q and the ST314 student survey dataset, f20-st314-student-survey.csv to explore one categorical and one quantitative variable of your choice. Download the script and the dataset, open the script and follow the command instructions. Check out the dataset legend to see what variables represent. Then answer the following questions: Categorical Variable a. (1 point) Choose a categorical variable to explore. Which variable did you choose? Note: "SubiectPreferred" is off limits given this was my example. Choose something else. b. (2 point) Paste the table of counts and bar chart for the categorical variable of your choosing. Include color and an appropriate title on your plot. C. (2 point) Briefly, describe the distribution in context. Recall, categorical variables are summarized by counts and/or percents. | Quantitative Variable a. (1 point) Choose a quantitative variable to explore. Which variable did you choose? Note: "Email" is off limits given this was my example. Choose something else. b. (2 point) Create a histogram of the variable. Include color and an appropriate title on your plot. Paste plot. C. (2 point) Create a boxplot of the variable. Include color and an appropriate title on your plot. Paste plot. d. (1 point) Which plot do you prefer to visualize the variable? Why? e. (2 points) Give a table that includes the mean, standard deviation, minimum, 15 quartile, median, 3rd quartile, maximum and IQR. f. (3 points) Use the plots and summary statistics to describe the data in the context of the problem. Include the shape, center and spread in your description. State whether there are any outliers. 8. (2 points) Given the shape of the data which measure, the mean, median or either, would be a more appropriate to represent the center of the data? Explain your reasoning


