

Question: Part 2 - Calculate It- Use the graph above to calculate the following before and after the tax is imposed. Before Tax After Tax 6.
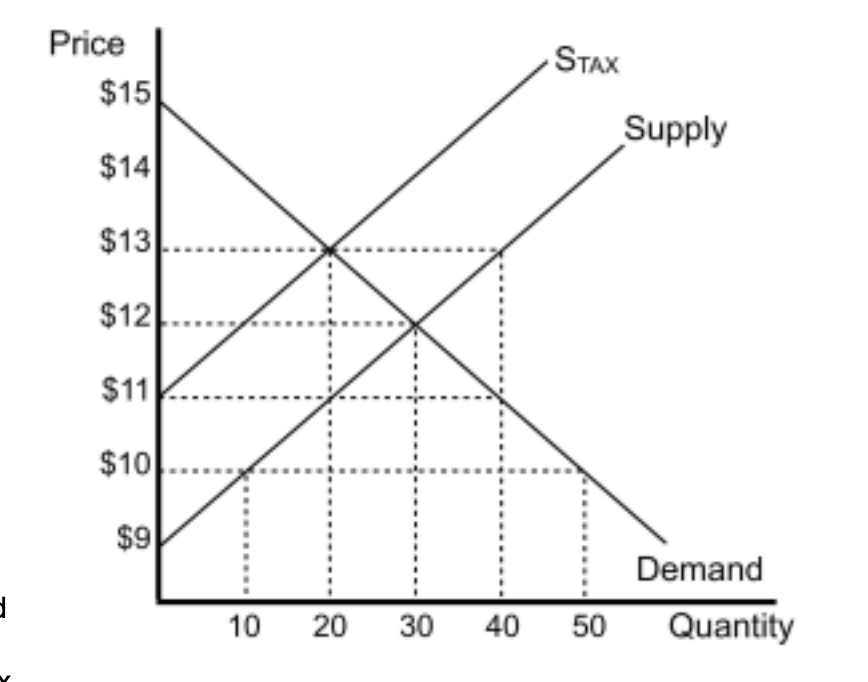
Part 2 - Calculate It- Use the graph above to calculate the following before and after the tax is imposed. Before Tax After Tax 6. Total expenditures by consumers 7. Total revenue collected by firms 8. Total tax revenue collected by the government 9. Consumer Surplus 10. Producer Surplus 11. Total Surplus 12. Deadweight Loss Part 3 - Making Connections- Answer the following question using the graph above. 13. Who contributed more to the total tax revenue: consumers or producers? Explain how you determined your answer.Price STAX $15 Supply $14 $13 ...... $12 .... X $11 $10 . ... $9 Demand 10 20 30 40 50 Quantity
Step by Step Solution
There are 3 Steps involved in it
1 Expert Approved Answer
Step: 1 Unlock

Question Has Been Solved by an Expert!
Get step-by-step solutions from verified subject matter experts
Step: 2 Unlock
Step: 3 Unlock