

Question: Part 2: Circle Graphs The pie chart (circle graph) and table below represents the monthly budget for Johnny Applewood. Monthly Expenses otherape GY ak Dhing
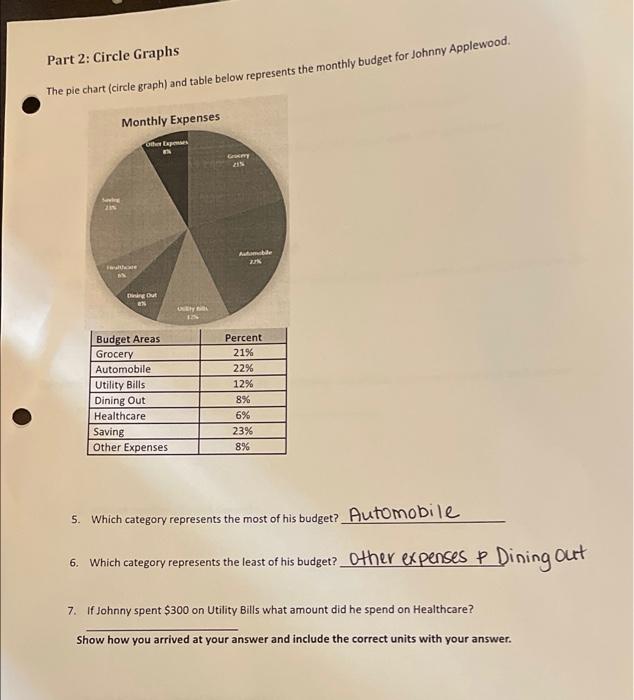
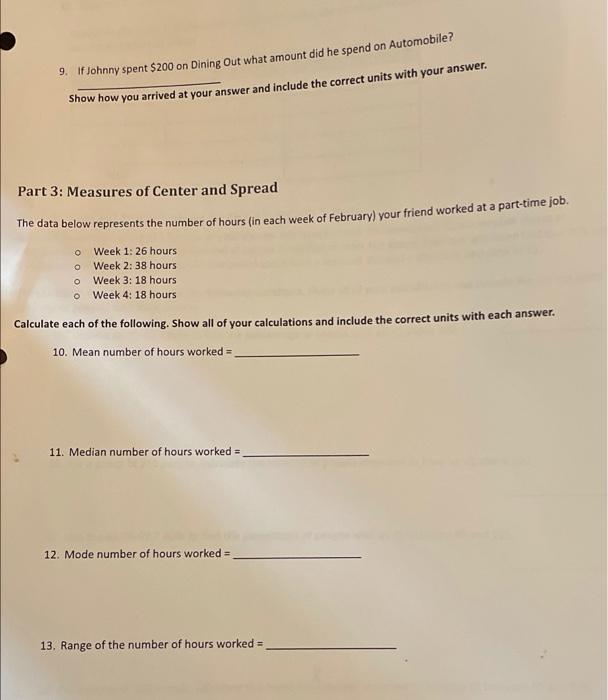
Part 2: Circle Graphs The pie chart (circle graph) and table below represents the monthly budget for Johnny Applewood. Monthly Expenses otherape GY ak Dhing Out -- Budget Areas Grocery Automobile Utility Bills Dining Out Healthcare Saving Other Expenses Percent 21% 22% 12% 8% 6% 23% 8% 5. Which category represents the most of his budget? Automobile 6. Which category represents the least of his budget? Other expenses p Dining out 7. if Johnny spent $300 on Utility Bills what amount did he spend on Healthcare? Show how you arrived at your answer and include the correct units with your answer. 9. If Johnny spent $200 on Dining Out what amount did he spend on Automobile? Show how you arrived at your answer and include the correct units with your answer. Part 3: Measures of Center and Spread The data below represents the number of hours (in each week of February) your friend worked at a part-time job. o Week 1:26 hours o Week 2: 38 hours o Week 3: 18 hours o Week 4: 18 hours Calculate each of the following. Show all of your calculations and include the correct units with each answer. 10. Mean number of hours worked = 11. Median number of hours worked = 12. Mode number of hours worked = 13. Range of the number of hours worked
Step by Step Solution
There are 3 Steps involved in it

Get step-by-step solutions from verified subject matter experts