

Question: Part 2 graphing Interpreting and creating graphs and charts is an important skill for all fields of study, particularly in the sciences. Watch this video
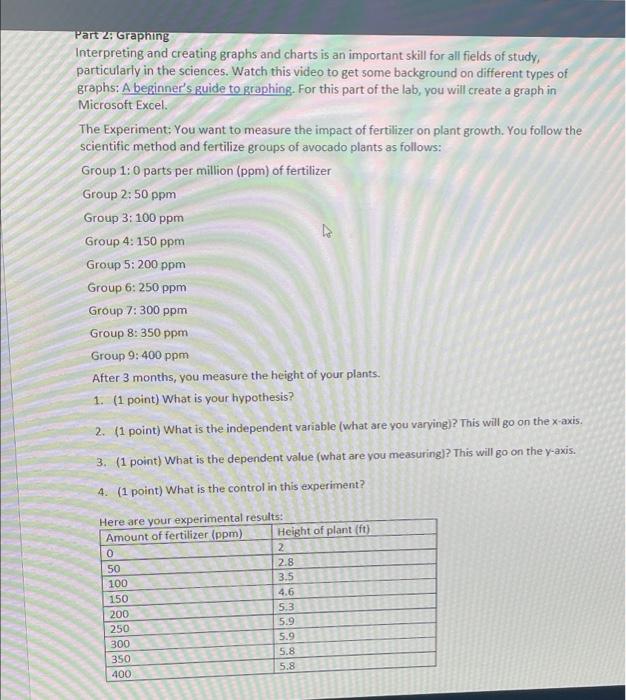
Part 2 graphing Interpreting and creating graphs and charts is an important skill for all fields of study, particularly in the sciences. Watch this video to get some background on different types of graphs: A beginner's guide to graphing. For this part of the lab, you will create a graph in Microsoft Excel. The Experiment: You want to measure the impact of fertilizer on plant growth. You follow the scientific method and fertilize groups of avocado plants as follows: Group 1:0 parts per million (ppm) of fertilizer Group 2:50 ppm Group 3: 100 ppm Group 4: 150 ppm Group 5: 200 ppm Group 6: 250 ppm Group 7: 300 ppm Group 8: 350 ppm Group 9: 400 ppm After 3 months, you measure the height of your plants. 1. (1 point) What is your hypothesis? 2. (1 point) What is the independent variable (what are you varying)? This will go on the x-axis. 3. (1 point) What is the dependent value (what are you measuring)? This will go on the y-axis. 4. (1 point) What is the control in this experiment? 100 Here are your experimental results: Amount of fertilizer (ppm) Height of plant (ft) O 2 50 2.8 100 3.5 150 4.6 200 5.3 5.9 300 5.9 5.8 400 5.8 250 350
Step by Step Solution
There are 3 Steps involved in it

Get step-by-step solutions from verified subject matter experts