

Question: Part 2: nonlinear models (a) (5 pts) As an experienced modeler, you now continue your work to consider the more sophisticated model Ro Pt Pt+1
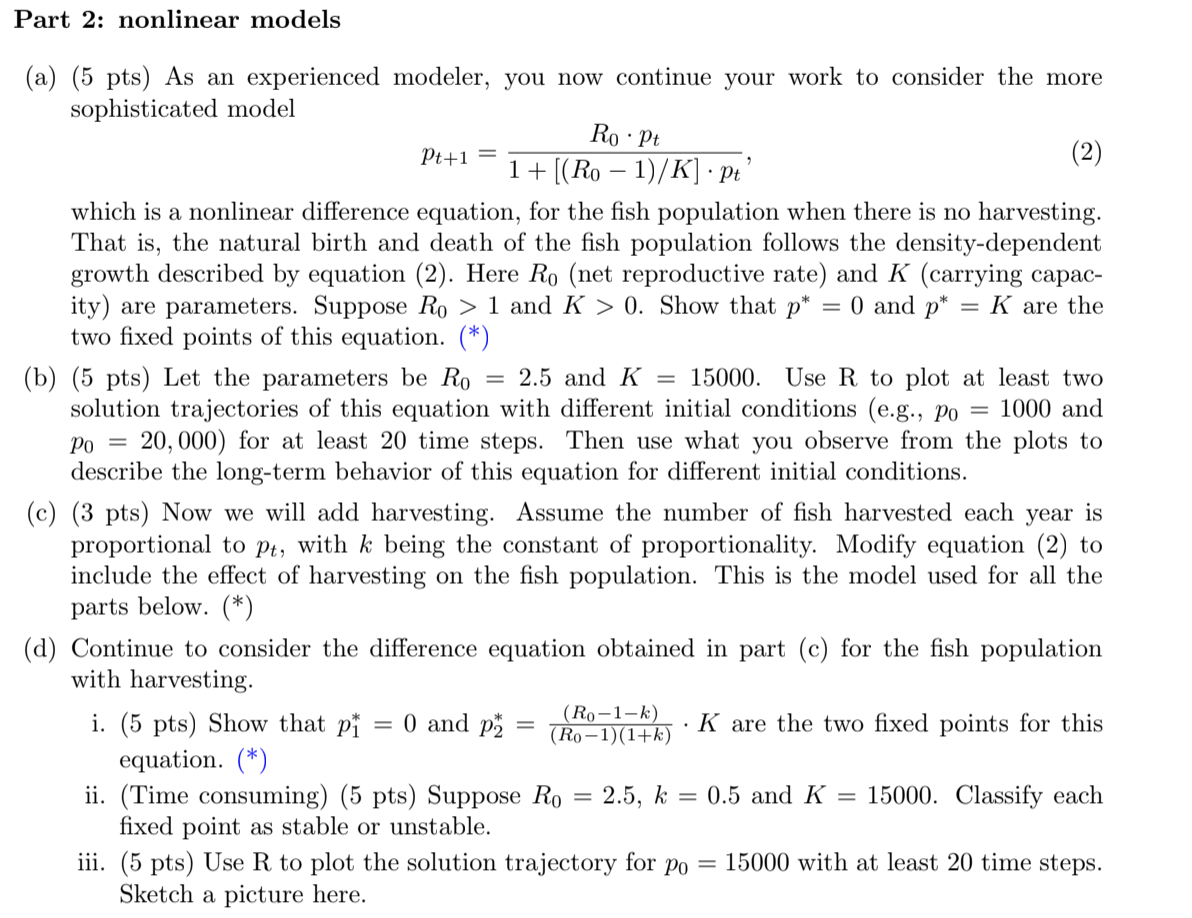
Part 2: nonlinear models (a) (5 pts) As an experienced modeler, you now continue your work to consider the more sophisticated model Ro Pt Pt+1 = 1+[(Ro 1)/K] pt which is a nonlinear difference equation, for the fish population when there is no harvesting. That is, the natural birth and death of the fish population follows the density-dependent growth described by equation (2). Here Ro (net reproductive rate) and K (carrying capac- ity) are parameters. Suppose Ro > 1 and K > 0. Show that p* 0 and p* = K are the two fixed points of this equation. (*) (b) (5 pts) Let the parameters be Ro 2.5 and K = 15000. Use R to plot at least two solution trajectories of this equation with different initial conditions (e.g., po = 1000 and Po = 20,000) for at least 20 time steps. Then use what you observe from the plots to describe the long-term behavior of this equation for different initial conditions. (c) (3 pts) Now we will add harvesting. Assume the number of fish harvested each year is proportional to pt, with k being the constant of proportionality. Modify equation (2) to include the effect of harvesting on the fish population. This is the model used for all the parts below. (*) (d) Continue to consider the difference equation obtained in part (c) for the fish population with harvesting. (R0-1-k) i. (5 pts) Show that pi = 0 and pm (Ro-1)(1+k) K are the two fixed points for this equation. (*) ii. (Time consuming) (5 pts) Suppose Ro 2.5, k = 0.5 and K 15000. Classify each fixed point as stable or unstable. iii. (5 pts) Use R to plot the solution trajectory for po 15000 with at least 20 time steps. Sketch a picture here. Part 2: nonlinear models (a) (5 pts) As an experienced modeler, you now continue your work to consider the more sophisticated model Ro Pt Pt+1 = 1+[(Ro 1)/K] pt which is a nonlinear difference equation, for the fish population when there is no harvesting. That is, the natural birth and death of the fish population follows the density-dependent growth described by equation (2). Here Ro (net reproductive rate) and K (carrying capac- ity) are parameters. Suppose Ro > 1 and K > 0. Show that p* 0 and p* = K are the two fixed points of this equation. (*) (b) (5 pts) Let the parameters be Ro 2.5 and K = 15000. Use R to plot at least two solution trajectories of this equation with different initial conditions (e.g., po = 1000 and Po = 20,000) for at least 20 time steps. Then use what you observe from the plots to describe the long-term behavior of this equation for different initial conditions. (c) (3 pts) Now we will add harvesting. Assume the number of fish harvested each year is proportional to pt, with k being the constant of proportionality. Modify equation (2) to include the effect of harvesting on the fish population. This is the model used for all the parts below. (*) (d) Continue to consider the difference equation obtained in part (c) for the fish population with harvesting. (R0-1-k) i. (5 pts) Show that pi = 0 and pm (Ro-1)(1+k) K are the two fixed points for this equation. (*) ii. (Time consuming) (5 pts) Suppose Ro 2.5, k = 0.5 and K 15000. Classify each fixed point as stable or unstable. iii. (5 pts) Use R to plot the solution trajectory for po 15000 with at least 20 time steps. Sketch a picture here
Step by Step Solution
There are 3 Steps involved in it

Get step-by-step solutions from verified subject matter experts