

Question: Part 2 : Predator - Prey Simulation Spreadsheets can perform simple simulations. One such simulation is to look at the populations of rabbits and wolves
Part : PredatorPrey Simulation
Spreadsheets can perform simple simulations. One such simulation is to look at the
populations of rabbits and wolves as they interact with each other. As the population of
rabbits grows there is more food available for wolves. Wolves then have more offspring
which eventually means that more wolves are chasing rabbits. This will result in more
predation and the population of rabbits will go down. Wolves will go hungry and produce
fewer offspring. Consequently more rabbits will survive and they will have more offspring
and the cycle continues.
We can simulate this cycle. Biologists have come up with models for this and we will be
exploring one of them. We will simulate the change of these populations as a function of
time.
Let w be the number of wolves and r be the number of rabbits. Let k be the reproductive
rate of rabbits, k be the reproductive rates of wolves and let k be the mortality rate of
wolves. During each time period we will evaluate the change in populations using these
two formulas:
Change in number of rabbits: Delta rkrkrw
Change in number of wolves: Delta wkrwkw
Thus the new populations will be:
rrDelta r
wwDelta w Rabbit Growth Wolf Growth Wolf Mortality
k k k
Time Rabbits Wolves
r w
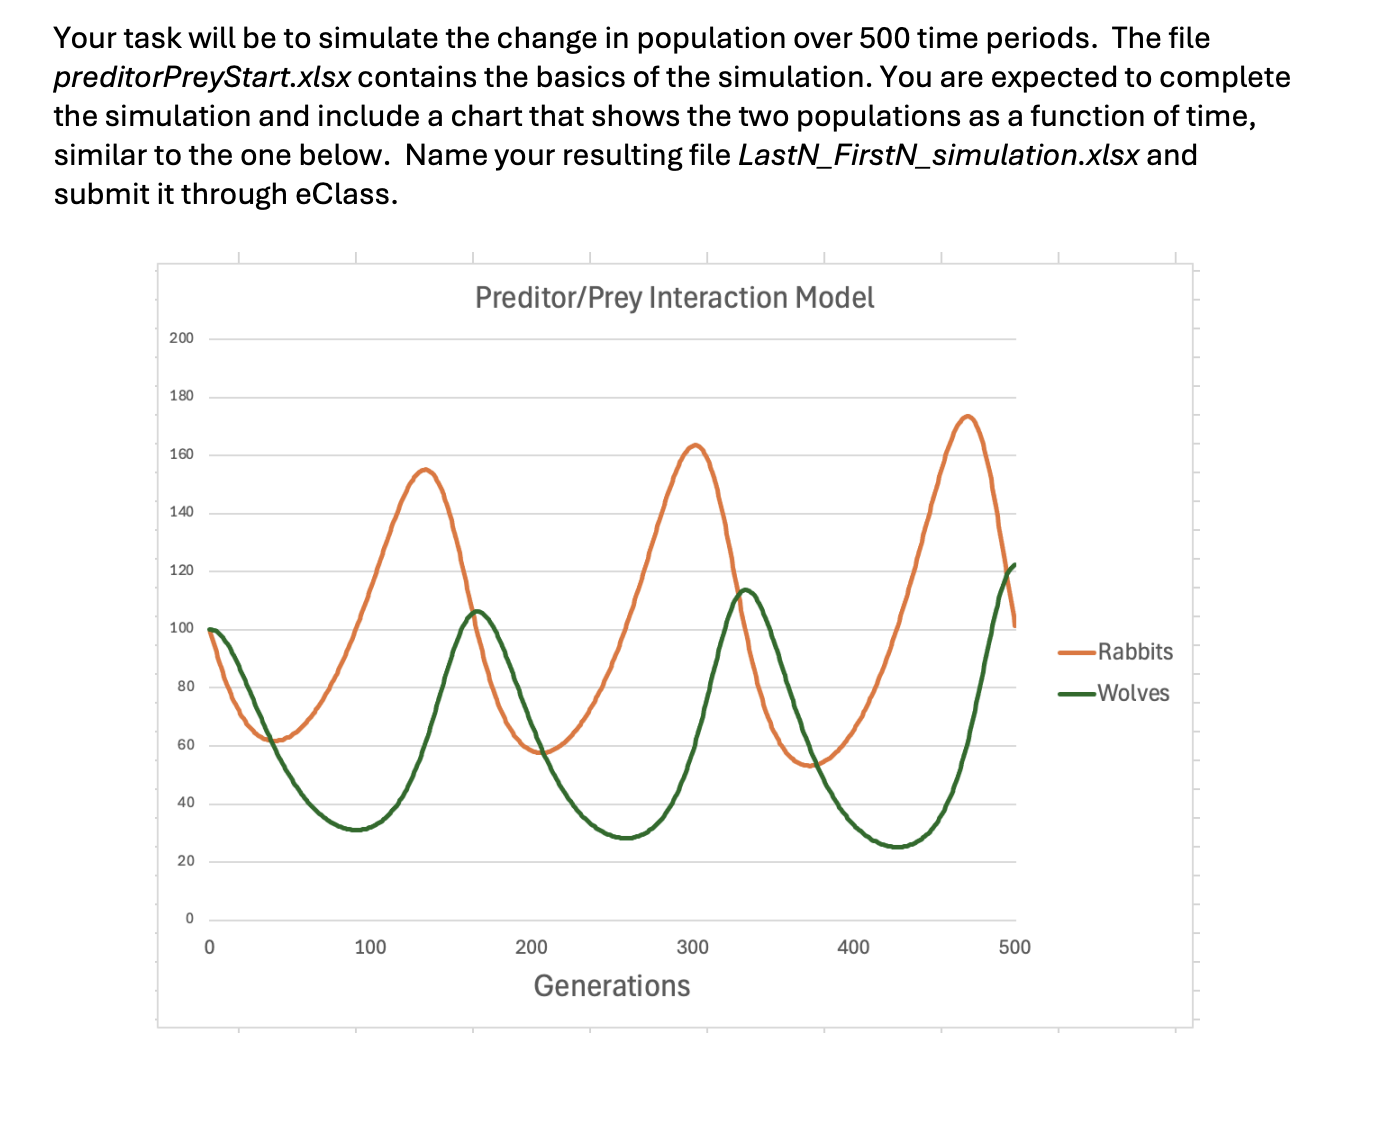
Your task will be to simulate the change in population over time periods. The file
preditorPreyStart.xlsx contains the basics of the simulation. You are expected to complete
the simulation and include a chart that shows the two populations as a function of time,
similar to the one below. Name your resulting file LastNFirstNsimulation.xlsx and
submit it through eClass.
Step by Step Solution
There are 3 Steps involved in it
1 Expert Approved Answer
Step: 1 Unlock

Question Has Been Solved by an Expert!
Get step-by-step solutions from verified subject matter experts
Step: 2 Unlock
Step: 3 Unlock