

Question: Part 2 - The second model is for a project for Gardial Fisheries. GardialFisheries is considering two mutually exclusive investments. The projects expected net cash
Part 2 -
The second model is for a project for Gardial Fisheries. GardialFisheries is considering two mutually exclusive investments. The projects expected net cash flows are as follows: Expected Net Cash Flows for the 7 year Project are:
Project A $375, 300, 200, 100, 600, 600, 926 and, 200
Project B $575, 190, 190, 190, 190, 190, 190 and, 0
- If each projects cost of capital is 12%, which project should be selected? If the cost of capital is 18%, what project is the proper choice?
- Construct NPV profiles for Projects A and B.
- What is each projects IRR?
- What is the crossover rate, and what is its significance?
- What is each projects MIRR at a cost of capital of 12%? At r 18%? (Hint: Consider Period 7 as the end of Project Bs life.)
- What is the regular payback period for these two projects? (Hint: Excels PERCENTRANK function may not work correctly for Project A because it has nonnormal cash flows.)
- At a cost of capital of 12%, what is the discounted payback period for these two projects?
- What is the profitability index for each project if the cost of capital is 12
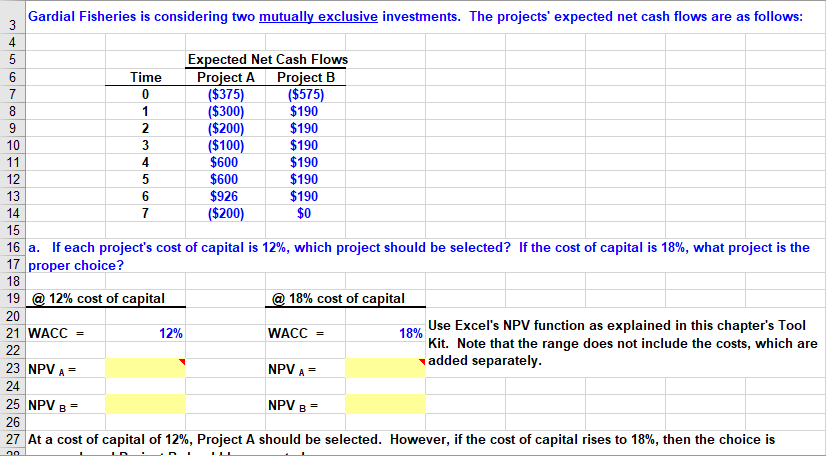
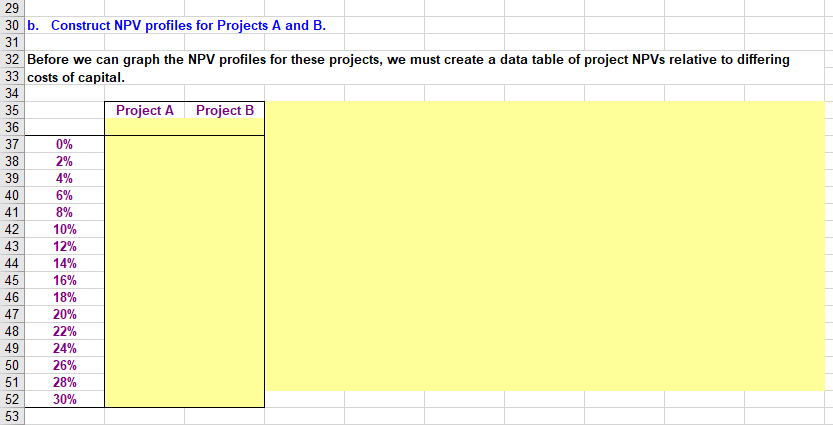
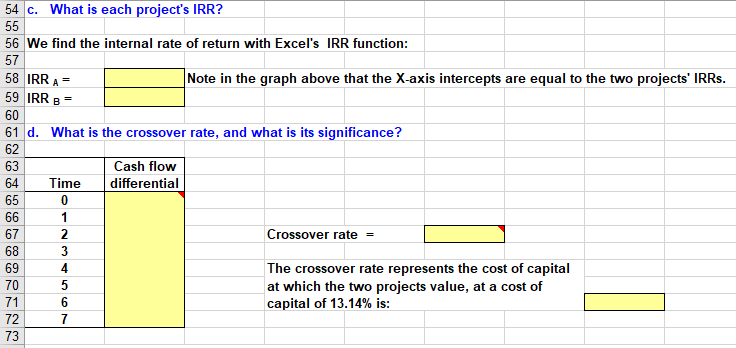
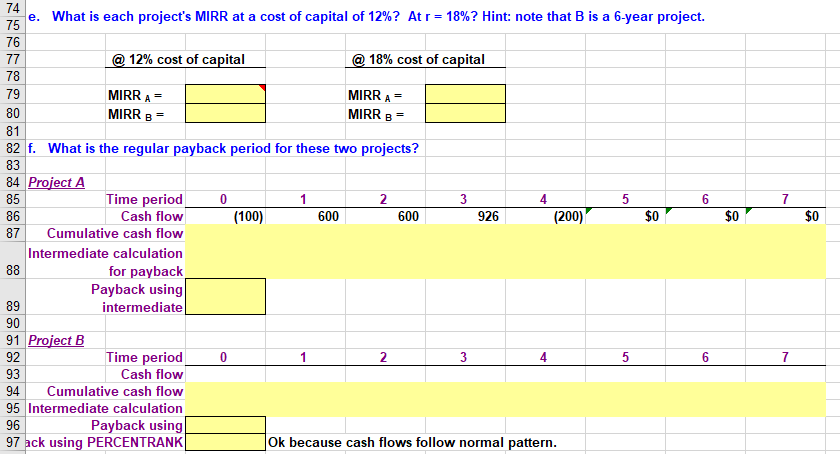
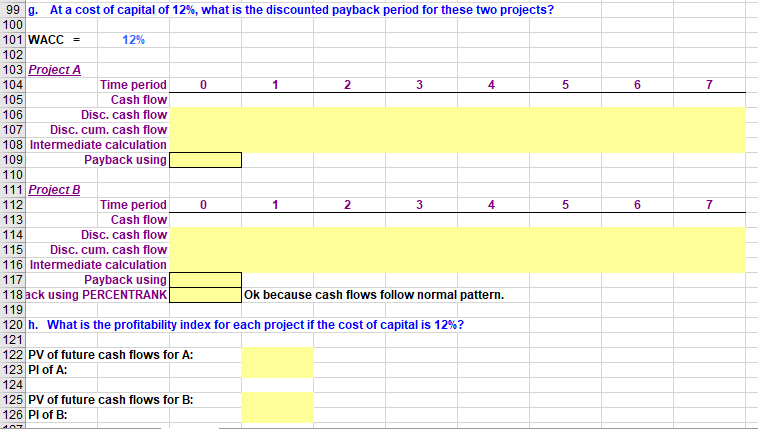
Gardial Fisheries is considering two mutually exclusive investments. The projects' expected net cash flows are as follows Expected Net Cash Flows Project A Project B Time ($375) ($300) ($200) ($100) $600 $600 $926 $200 ($575) $190 $190 $190 $190 $190 $190 $0 10 12 13 15 16 a. If each project's cost of capital is 12%, which project should be selected? If the cost of capital is 18%, what project is the 17 proper choice? 18 19 a 12% cost of capital 20 21 WACC - 18% cost of capital Use Excel's NPV function as explained in this chapter's Tool Kit. Note that the range does not include the costs, which are added separately 12% 18% 23 NPV A = 24 25 NPV B = 26 27 At a cost of capital of 12%, Project A should be selected. However, if the cost of capital rises to 18%, then the choice is NPV A NPV B- 29 30 b. Construct NPV profiles for Projects A and B 31 32 Before we can graph the NPV profiles for these projects, we must create a data table of project NPVs relative to differing 33 costs of capital 34 35 36 37 38 39 40 41 42 43 Project A Project B 0% 2% 4% 6% 8% 10% 12% 14% 16% 18% 20% 22% 24% 26% 28% 30% 45 46 47 2 48 49 50 51 | 52 53 54 c. What is each project's IRR? 56 We find the internal rate of return with Excel's IRR function: 57 58 IRR A- Note in the graph above that the X-axis intercepts are equal to the two projects' IRRs 60 61 d. What is the crossover rate, and what is its siqnificance? 62 63 64 Time differential 65 Cash flow 67 68 69 70 71 72 73 2 Crossover rate - 4 The crossover rate represents the cost of capital at which the two projects value, at a cost of capital of 13.14% is: 74 75 76 e. What is each project's MIRR at a cost of capital of 12%? At r = 18%? Hint: note that B is a 6-year project. 12% cost of capital 18% cost of capital 78 79 80 81 82 f. What is the regular payback period for these two projects? 83 84 Project A 85 86 87 Cumulative cash flow MIRR A MIRR B MIRR A MIRR B ime perio 4 Cash flow (100) 600 600 926 (200) $0 $0 $0 Intermediate calculation for payback Payback using intermediate 89 90 91 Project B 92 93 94 Cumulative cash flow 95 Intermediate calculation 96 97 ack using PERCENTRANK ime perio 4 Cash flow Payback using Ok because cash flows follow normal pattern 99 g. At a cost of capital of 12%, what is the discounted payback period for these two projects? 100 101 WACC - 102 12% 103 ProiectA 104 105 106 107Disc. cum. cash flow 108 Intermediate calculation 109 110 111 Project B 112 113 114 115 Disc. cum. cash flow 116 Intermediate calculation 4 5 Time period Cash flovw Disc. cash flow 0 Payback using 4 5 Time period Cash flovw Disc. cash flow 0 Payback using Ok because cash flows follow normal pattern. 118ack using PERCENTRANK 119 120 h. What is the profitability index for each project if the cost of capital is 12%? 121 122 PV of future cash flows for A 123 Pl of A: 124 125 PV of future cash flows for B: 126 Pl of B
Step by Step Solution
There are 3 Steps involved in it

Get step-by-step solutions from verified subject matter experts