

Question: Part 3: Answer the questions below (forecast errors below are based on different data than that shown above) begin{tabular}{|r|r|r|r|} cline { 2 - 4 }
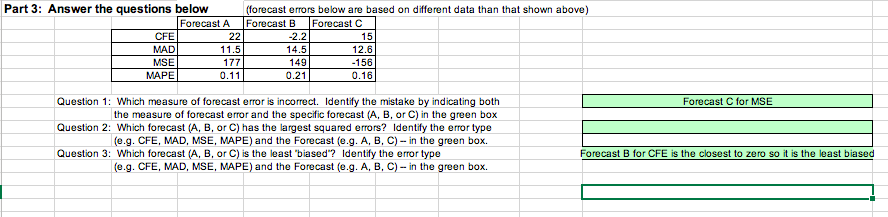
Part 3: Answer the questions below (forecast errors below are based on different data than that shown above) \begin{tabular}{|r|r|r|r|} \cline { 2 - 4 } \multicolumn{1}{l|}{} & Forecast A & Forecast B & Forecast C \\ \hline CFE & 22 & 2.2 & 15 \\ \hline MAD & 11.5 & 14.5 & 12.6 \\ \hline MSE & 177 & 149 & 156 \\ \hline MAPE & 0.11 & 0.21 & 0.16 \\ \hline \end{tabular} Question 1: Which measure of forecast error is incorrect. Identify the mistake by indicating both Forecast C for MSE the measure of forecast error and the specific forecast (A,B, or C) in the green box Question 2: Which forecast (A,B, or C) has the largest squared errors? Identify the error type (e.g. CFE, MAD, MSE, MAPE) and the Forecast (e.g. A, B, C) - in the green box. Question 3: Which forecast (A,B, or C) is the least "biased"? Identify the error type Forecast B for CFE is the closest to zero so it is the least biased (e.g. CFE, MAD, MSE, MAPE) and the Forecast (e.g. A, B, C) - in the green box
Step by Step Solution
There are 3 Steps involved in it

Get step-by-step solutions from verified subject matter experts