

Question: Part 3: Data Visualization Review the data table below and answer the following questions: # AL Whe Order ID Order Date Customer Segment State Product
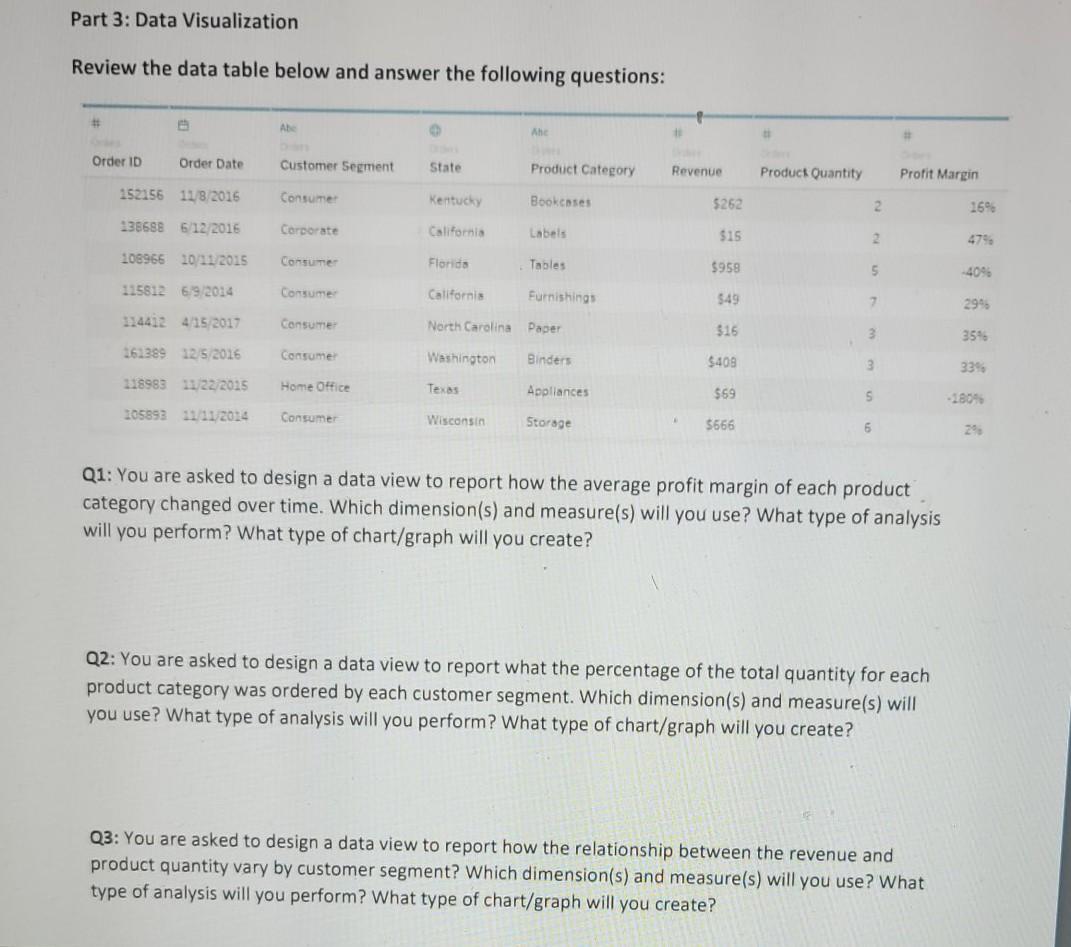
Part 3: Data Visualization Review the data table below and answer the following questions: # AL Whe Order ID Order Date Customer Segment State Product Category Revenue Product Quantity Profit Margin 152156 11/8/2016 Consumer Kentucky Bookcases $262 2 169 138688612/2016 Corporate California Labels $15 2 108966 10/11 2015 Consumer Florida Tables $958 5 404 1158126.9.2014 Consume California Furnishings $49 7 294 415 2017 Consumer North Carolina Paper $16 3 354 262389 12/5.2016 Consume Washington Binders $409 3 33% 118983 11/22/2015 Home Office Texas Appliances $69 5 -1804 305893 11/11/2014 Consumer Wisconsin Storage 5666 6 20 Q1: You are asked to design a data view to report how the average profit margin of each product category changed over time. Which dimension(s) and measure(s) will you use? What type of analysis will you perform? What type of chart/graph will you create? Q2: You are asked to design a data view to report what the percentage of the total quantity for each product category was ordered by each customer segment. Which dimension(s) and measure(s) will you use? What type of analysis will you perform? What type of chart/graph will you create? Q3: You are asked to design a data view to report how the relationship between the revenue and product quantity vary by customer segment? Which dimension(s) and measure(s) will you use? What type of analysis will you perform? What type of chart/graph will you create? Part 3: Data Visualization Review the data table below and answer the following questions: # AL Whe Order ID Order Date Customer Segment State Product Category Revenue Product Quantity Profit Margin 152156 11/8/2016 Consumer Kentucky Bookcases $262 2 169 138688612/2016 Corporate California Labels $15 2 108966 10/11 2015 Consumer Florida Tables $958 5 404 1158126.9.2014 Consume California Furnishings $49 7 294 415 2017 Consumer North Carolina Paper $16 3 354 262389 12/5.2016 Consume Washington Binders $409 3 33% 118983 11/22/2015 Home Office Texas Appliances $69 5 -1804 305893 11/11/2014 Consumer Wisconsin Storage 5666 6 20 Q1: You are asked to design a data view to report how the average profit margin of each product category changed over time. Which dimension(s) and measure(s) will you use? What type of analysis will you perform? What type of chart/graph will you create? Q2: You are asked to design a data view to report what the percentage of the total quantity for each product category was ordered by each customer segment. Which dimension(s) and measure(s) will you use? What type of analysis will you perform? What type of chart/graph will you create? Q3: You are asked to design a data view to report how the relationship between the revenue and product quantity vary by customer segment? Which dimension(s) and measure(s) will you use? What type of analysis will you perform? What type of chart/graph will you create
Step by Step Solution
There are 3 Steps involved in it
1 Expert Approved Answer
Step: 1 Unlock

Question Has Been Solved by an Expert!
Get step-by-step solutions from verified subject matter experts
Step: 2 Unlock
Step: 3 Unlock