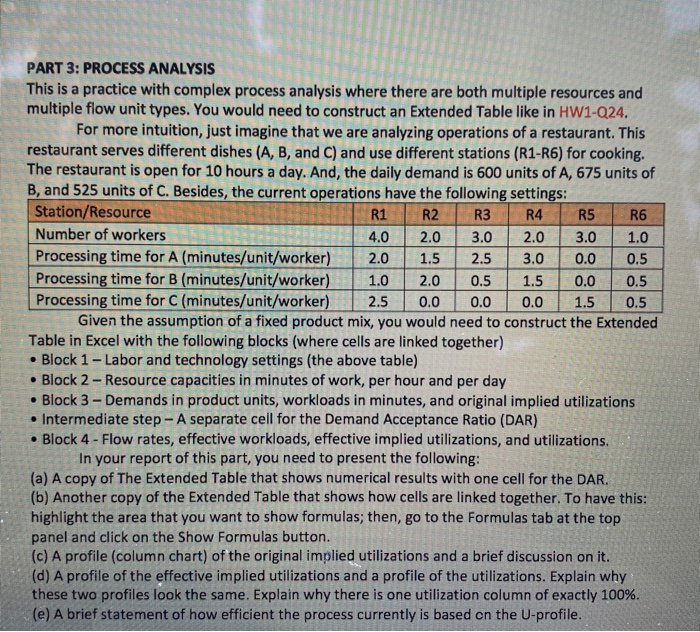
Question: PART 3: PROCESS ANALYSIS This is a practice with complex process analysis where there are both multiple resources and multiple flow unit types. You would

PART 3: PROCESS ANALYSIS This is a practice with
PART 3: PROCESS ANALYSIS This is a practice with complex process analysis where there are both multiple resources and multiple flow unit types. You would need to construct an Extended Table like in HW1-Q24. For more intuition, just imagine that we are analyzing operations of a restaurant. This restaurant serves different dishes (A, B, and C) and use different stations (R1-R6) for cooking. The restaurant is open for 10 hours a day. And, the daily demand is 600 units of A, 675 units of B, and 525 units of C. Besides, the current operations have the following settings: Station/Resource 3 5 R1 R2 R3 R4 R5 R6 Number of workers | 4.0 2.0 3.0 2.0 3.0 1.0 Processing time for A (minutes/unit/worker) 2.0 1.5 2.5 3.0 0.0 0.5 Processing time for B (minutes/unit/worker) 1.0 2.0 0.5 1.5 0.0 0.5 Processing time for C (minutes/unit/worker) 2.5 0.0 0.0 0.0 1.5 0.5 Given the assumption of a fixed product mix, you would need to construct the Extended Table in Excel with the following blocks (where cells are linked together) Block 1 - Labor and technology settings (the above table) Block 2 - Resource capacities in minutes of work, per hour and per day Block 3 - Demands in product units, workloads in minutes, and original implied utilizations Intermediate step - A separate cell for the Demand Acceptance Ratio (DAR) Block 4 - Flow rates, effective workloads, effective implied utilizations, and utilizations. In your report of this part, you need to present the following: (a) A copy of The Extended Table that shows numerical results with one cell for the DAR. (b) Another copy of the Extended Table that shows how cells are linked together. To have this: highlight the area that you want to show formulas; then, go to the Formulas tab at the top panel and click on the Show Formulas button. (c) A profile (column chart) of the original implied utilizations and a brief discussion on it. (d) A profile of the effective implied utilizations and a profile of the utilizations. Explain why these two profiles look the same. Explain why there is one utilization column of exactly 100%. (e) A brief statement of how efficient the process currently is based on the U-profile

Step by Step Solution

There are 3 Steps involved in it

1 Expert Approved Answer
Step: 1 Unlock blur-text-image
Question Has Been Solved by an Expert!

Get step-by-step solutions from verified subject matter experts

Step: 2 Unlock
Step: 3 Unlock

Students Have Also Explored These Related General Management Questions!