

Question: PART 3 - Read in values from a real data source using the Import Tool The Bureau of Meteorology (BOM) store a significant amount of
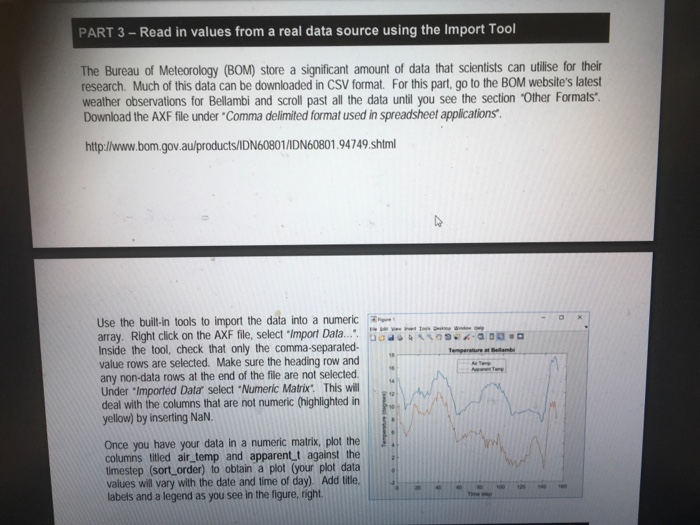
PART 3 - Read in values from a real data source using the Import Tool The Bureau of Meteorology (BOM) store a significant amount of data that scientists can utilise for their research. Much of this data can be downloaded in CSV format. For this part, go to the BOM website's latest weather observations for Bellambi and scroll past all the data until you see the section Other Formats* Download the AXF file under Comma delimited format used in spreadsheet applications http//www.bom.gov.au/products/IDN60801/IDN60801.94749.shtml Use the built-in tools to import the data into a numeric array. Right click on the AXF file, select 'import Data ".-da-M Inside the tool, check that only the comma-separated- value rows are selected. Make sure the heading row and any non-data rows at the end of the file are not selected. Under Imported Data select Numeric Matrix This will deal with the columns that are not numeric (highlighted in : yellow) by inserting NaN. Q Temperature at Belamb Once you have your data in a numeric matrix, plot the columns titled air_temp and apparentt against the timestep (sort_order) to obtain a plot (your plot data values will vary with the date and time of day). Add title, labels and a legend as you see in the figure, right
Step by Step Solution
There are 3 Steps involved in it

Get step-by-step solutions from verified subject matter experts