

Question: Part 3 Using excel please create a clustered bar chart with average returns and standard deviations being represented by two different color bars. On the
Part 3
Using excel please create a clustered bar chart with average returns and standard deviations being represented by two different color bars. On the horizontal axis please include each fund type (similar to where you see the months in the below graph). If your bars are hard to interpret, please include a dual axis as seen in the below picture. Then, after constructing the graph infer what the output of the graph means in the relationship between standard deviation and average returns. Are the two related? If so, what kind of relationship exists between them?
Given your determination of the given analysis, what is the best course of action that companies need to take in determining the impact of their management techniques? Write 3-4 paragraphs explaining the problem, which analysis was used, the supporting data and your overall suggestions to the higher ups. Conclude your writing with a few short paragraphs describing your case in non-technical language so that anyone can read and articulate your arguments, despite their academic background.
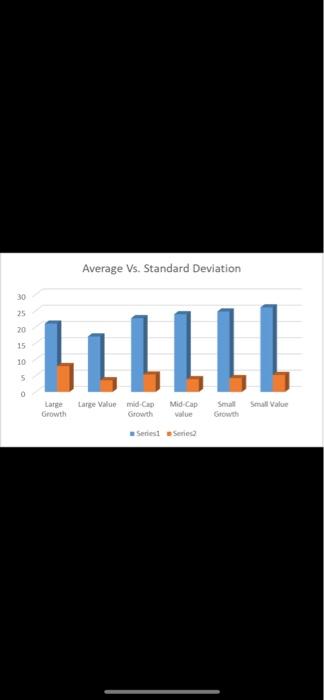
Average Vs. Standard Deviation 30 25 20 15 LLLLLL 10 5 0 Large Value mid-Cap Large Growth Mid-Cap Small Small Value Growth value Growth Series Series2
Step by Step Solution
There are 3 Steps involved in it

Get step-by-step solutions from verified subject matter experts